
How-to
Empowering engineers with everything they need to build, monitor, and scale real-time data pipelines with confidence.

Heading 1
Heading 2
Heading 3
Heading 4
Heading 5
Heading 6
Lorem ipsum dolor sit amet, consectetur adipiscing elit, sed do eiusmod tempor incididunt ut labore et dolore magna aliqua. Ut enim ad minim veniam, quis nostrud exercitation ullamco laboris nisi ut aliquip ex ea commodo consequat. Duis aute irure dolor in reprehenderit in voluptate velit esse cillum dolore eu fugiat nulla pariatur.
Block quote
Ordered list
- Item 1
- Item 2
- Item 3
Unordered list
- Item A
- Item B
- Item C
Bold text
Emphasis
Superscript
Subscript
Integrate Kpow with Oracle Compute Infrastructure (OCI) Streaming with Apache Kafka
Unlock the full potential of your dedicated OCI Streaming with Apache Kafka cluster. This guide shows you how to integrate Kpow with your OCI brokers and self-hosted Kafka Connect and Schema Registry, unifying them into a single, developer-ready toolkit for complete visibility and control over your entire Kafka ecosystem.
Overview
When working with real-time data on Oracle Cloud Infrastructure (OCI), you have two powerful, Kafka-compatible streaming services to choose from:
- OCI Streaming with Apache Kafka: A dedicated, managed service that gives you full control over your own Apache Kafka cluster.
- OCI Streaming: A serverless, Kafka-compatible platform designed for effortless, scalable data ingestion.
Choosing the dedicated OCI Streaming with Apache Kafka service gives you maximum control and the complete functionality of open-source Kafka. However, this control comes with a trade-off: unlike some other managed platforms, OCI does not provide managed Kafka Connect or Schema Registry services, recommending users provision them on custom instances.
This guide will walk you through integrating Kpow with your OCI Kafka cluster, alongside self-hosted instances of Kafka Connect and Schema Registry. The result is a complete, developer-ready environment that provides full visibility and control over your entire Kafka ecosystem.
❗ Note on the serverless OCI Streaming service: While you can connect Kpow to OCI's serverless offering, its functionality is limited because some Kafka APIs are yet to be implemented. Our OCI provider documentation explains how to connect, and you can review the specific API gaps in the official Oracle documentation.
💡 Explore our setup guides for other leading platforms like Confluent Cloud, Amazon MSK, and Google Cloud Kafka, or emerging solutions like Redpanda, BufStream, and the Instaclustr Platform.
About Factor House
Factor House is a leader in real-time data tooling, empowering engineers with innovative solutions for Apache Kafka® and Apache Flink®.
Our flagship product, Kpow for Apache Kafka, is the market-leading enterprise solution for Kafka management and monitoring.
Explore our live multi-cluster demo environment or grab a free Community license and dive into streaming tech on your laptop with Factor House Local.
.png)
Prerequisites
Before creating a Kafka cluster, you must set up the necessary network infrastructure within your OCI tenancy. The Kafka cluster itself is deployed directly into this network, and this setup is also what ensures that your client applications (like Kpow) can securely connect to the brokers.
As detailed in the official OCI documentation, you will need:
- A Virtual Cloud Network (VCN): The foundational network for your cloud resources.
- A Subnet: A subdivision of your VCN where you will launch the Kafka cluster and client VM.
- Security Rules: Ingress rules configured in a Security List or Network Security Group to allow traffic on the required ports. For this guide, which uses SASL/SCRAM, you must open port 9092. If you were using mTLS, you would open port 9093.
Create a Vault Secret
OCI Kafka leverages the OCI Vault service to securely manage the credentials used for SASL/SCRAM authentication.
First, create a Vault in your desired compartment. Inside that Vault, create a new Secret with the following JSON content, replacing the placeholder values with your desired username and a strong password.
{ "username": "<vault-username>", "password": "<value-password>" }Take note of the following details, as you will need them when creating the Kafka cluster:
- SASL SCRAM - Vault compartment:
<compartment-name> - SASL SCRAM - Vault:
<vault-name> - SASL SCRAM - Secret compartment:
<compartment-name> - SASL SCRAM - Secret:
<value-secret-name>
Create IAM Policies
To allow OCI to manage your Kafka cluster and its associated network resources, you must create several IAM policies. These policies grant permissions to both user groups (for administrative actions) and the Kafka service principal (for operational tasks).
The required policies are detailed in the "Required IAM Policies" section of the OCI Kafka documentation. Apply these policies in your tenancy's root compartment to ensure the Kafka service has the necessary permissions.
Create a Kafka Cluster
With the prerequisites in place, you can now create your Kafka cluster from the OCI console.
- Navigate to Developer Services > Application Integration > OCI Streaming with Apache Kafka.
- Click Create cluster and follow the wizard:
- Cluster settings: Provide a name, select your compartment, and choose a Kafka version (e.g., 3.7).
- Broker settings: Choose the number of brokers, the OCPU count per broker, and the block volume storage per broker.
- Cluster configuration: OCI creates a default configuration for the cluster. You can review and edit its properties here. For this guide, add
auto.create.topics.enable=trueto the default configuration. Note that after creation, the cluster's configuration can only be changed using the OCI CLI or SDK. - Security settings: This section is for configuring Mutual TLS (mTLS). Since this guide uses SASL/SCRAM, leave this section blank. We will configure security after the cluster is created.
- Networking: Choose the VCN and subnet you configured in the prerequisites.
- Review your settings and click Create. OCI will begin provisioning your dedicated Kafka cluster.
- Once the cluster's status becomes Active, select it from the cluster list page to view its details.
- From the details page, select the Actions menu and then select Update SASL SCRAM.
- In the Update SASL SCRAM panel, select the Vault and the Secret that contain your secure credentials.
- Select Update.
- After the update is complete, return to the Cluster Information section and copy the Bootstrap Servers endpoint for SASL-SCRAM. You will need this for the next steps.
Launch a Client VM
We need a virtual machine to host Kpow, Kafka Connect, and Schema Registry. This VM must have network access to the Kafka cluster.
- Create Instance & Save SSH Key: Navigate to Compute > Instances and begin to create a new compute instance.
- Select an Ubuntu image.
- In the "Add SSH keys" section, choose the option to "Generate a key pair for me" and click the "Save Private Key" button. This is your only chance to download this key, which is required for SSH access.
- Configure Networking: During the instance creation, configure the networking as follows:
- Placement: Assign the instance to the same VCN as your Kafka cluster, in a subnet that can reach your Kafka brokers.
- Kpow UI Access: Ensure the subnet's security rules allow inbound TCP traffic on port 3000. This opens the port for the Kpow web interface.
- Internet Access: The instance needs outbound access to pull the Kpow Docker image.
- Simple Setup: For development, place the instance in a public subnet with an Internet Gateway.
- Secure (Production): We recommend using a private subnet with a NAT Gateway. This allows outbound connections without exposing the instance to inbound internet traffic.
- Connect and Install Docker: Once the VM is in the "Running" state, use the private key you saved to SSH into its public or private IP address and install Docker.
Deploying Kpow with Supporting Instances
On your client VM, we will use Docker Compose to launch Kpow, Kafka Connect, and Schema Registry.
First, create a setup script to prepare the environment. This script downloads the MSK Data Generator (a useful source connector for creating sample data) and sets up the JAAS configuration files required for Schema Registry's basic authentication.
Save the following as setup.sh:
#!/usr/bin/env bash

SCRIPT_PATH="$(cd $(dirname "$0"); pwd)"
DEPS_PATH=$SCRIPT_PATH/deps

rm -rf $DEPS_PATH && mkdir $DEPS_PATH

echo "Set-up environment..."

echo "Downloading MSK data generator..."
mkdir -p $DEPS_PATH/connector/msk-datagen
curl --silent -L -o $DEPS_PATH/connector/msk-datagen/msk-data-generator.jar \
  https://github.com/awslabs/amazon-msk-data-generator/releases/download/v0.4.0/msk-data-generator-0.4-jar-with-dependencies.jar


echo "Create Schema Registry configs..."
mkdir -p $DEPS_PATH/schema
cat << 'EOF' > $DEPS_PATH/schema/schema_jaas.conf
schema {
         org.eclipse.jetty.jaas.spi.PropertyFileLoginModule required
         debug="true"
         file="/etc/schema/schema_realm.properties";
     };
EOF

cat << 'EOF' > $DEPS_PATH/schema/schema_realm.properties
admin: CRYPT:adpexzg3FUZAk,schema-admin
EOF

echo "Environment setup completed."
Next, create a `docker-compose.yml` file. This defines our three services. Be sure to replace the placeholder values (<BOOTSTRAP_SERVER_ADDRESS>, <VAULT_USERNAME>, <VAULT_PASSWORD>) with your specific OCI Kafka details.
services:
  kpow:
    image: factorhouse/kpow-ce:latest
    container_name: kpow
    pull_policy: always
    restart: always
    ports:
      - "3000:3000"
    networks:
      - factorhouse
    depends_on:
      connect:
        condition: service_healthy
    environment:
      ENVIRONMENT_NAME: "OCI Kafka Cluster"
      BOOTSTRAP: "<BOOTSTRAP_SERVER_ADDRESS>"
      SECURITY_PROTOCOL: "SASL_SSL"
      SASL_MECHANISM: "SCRAM-SHA-512"
      SASL_JAAS_CONFIG: 'org.apache.kafka.common.security.scram.ScramLoginModule required username="<VAULT_USERNAME>" password="<VAULT_PASSWORD>";'
      CONNECT_NAME: "Local Connect Cluster"
      CONNECT_REST_URL: "http://connect:8083"
      SCHEMA_REGISTRY_NAME: "Local Schema Registry"
      SCHEMA_REGISTRY_URL: "http://schema:8081"
      SCHEMA_REGISTRY_AUTH: "USER_INFO"
      SCHEMA_REGISTRY_USER: "admin"
      SCHEMA_REGISTRY_PASSWORD: "admin"
    env_file:
      - license.env

  schema:
    image: confluentinc/cp-schema-registry:7.8.0
    container_name: schema_registry
    ports:
      - "8081:8081"
    networks:
      - factorhouse
    environment:
      SCHEMA_REGISTRY_HOST_NAME: "schema"
      SCHEMA_REGISTRY_KAFKASTORE_BOOTSTRAP_SERVERS: "<BOOTSTRAP_SERVER_ADDRESS>"
      ## Authentication
      SCHEMA_REGISTRY_KAFKASTORE_SECURITY_PROTOCOL: "SASL_SSL"
      SCHEMA_REGISTRY_KAFKASTORE_SASL_MECHANISM: "SCRAM-SHA-512"
      SCHEMA_REGISTRY_KAFKASTORE_SASL_JAAS_CONFIG: 'org.apache.kafka.common.security.scram.ScramLoginModule required username="<VAULT_USERNAME>" password="<VAULT_PASSWORD>";'
      SCHEMA_REGISTRY_AUTHENTICATION_METHOD: BASIC
      SCHEMA_REGISTRY_AUTHENTICATION_REALM: schema
      SCHEMA_REGISTRY_AUTHENTICATION_ROLES: schema-admin
      SCHEMA_REGISTRY_OPTS: -Djava.security.auth.login.config=/etc/schema/schema_jaas.conf
    volumes:
      - ./deps/schema:/etc/schema

  connect:
    image: confluentinc/cp-kafka-connect:7.8.0
    container_name: connect
    restart: unless-stopped
    ports:
      - 8083:8083
    networks:
      - factorhouse
    environment:
      CONNECT_BOOTSTRAP_SERVERS: "<BOOTSTRAP_SERVER_ADDRESS>"
      CONNECT_REST_PORT: "8083"
      CONNECT_GROUP_ID: "oci-demo-connect"
      CONNECT_CONFIG_STORAGE_TOPIC: "oci-demo-connect-config"
      CONNECT_OFFSET_STORAGE_TOPIC: "oci-demo-connect-offsets"
      CONNECT_STATUS_STORAGE_TOPIC: "oci-demo-connect-status"
      ## Authentication
      CONNECT_SECURITY_PROTOCOL: "SASL_SSL"
      CONNECT_SASL_MECHANISM: "SCRAM-SHA-512"
      CONNECT_SASL_JAAS_CONFIG: 'org.apache.kafka.common.security.scram.ScramLoginModule required username="<VAULT_USERNAME>" password="<VAULT_PASSWORD>";'
      # Propagate auth settings to internal clients
      CONNECT_PRODUCER_SECURITY_PROTOCOL: "SASL_SSL"
      CONNECT_PRODUCER_SASL_MECHANISM: "SCRAM-SHA-512"
      CONNECT_PRODUCER_SASL_JAAS_CONFIG: 'org.apache.kafka.common.security.scram.ScramLoginModule required username="<VAULT_USERNAME>" password="<VAULT_PASSWORD>";'
      CONNECT_CONSUMER_SECURITY_PROTOCOL: "SASL_SSL"
      CONNECT_CONSUMER_SASL_MECHANISM: "SCRAM-SHA-512"
      CONNECT_CONSUMER_SASL_JAAS_CONFIG: 'org.apache.kafka.common.security.scram.ScramLoginModule required username="<VAULT_USERNAME>" password="<VAULT_PASSWORD>";'
      CONNECT_KEY_CONVERTER: "org.apache.kafka.connect.json.JsonConverter"
      CONNECT_VALUE_CONVERTER: "org.apache.kafka.connect.json.JsonConverter"
      CONNECT_INTERNAL_KEY_CONVERTER: "org.apache.kafka.connect.json.JsonConverter"
      CONNECT_INTERNAL_VALUE_CONVERTER: "org.apache.kafka.connect.json.JsonConverter"
      CONNECT_REST_ADVERTISED_HOST_NAME: "localhost"
      CONNECT_LOG4J_ROOT_LOGLEVEL: "INFO"
      CONNECT_PLUGIN_PATH: /usr/share/java/,/etc/kafka-connect/jars
    volumes:
      - ./deps/connector:/etc/kafka-connect/jars
    healthcheck:
      test: ["CMD-SHELL", "curl -f http://localhost:8083/ || exit 1"]
      interval: 5s
      timeout: 3s
      retries: 10
      start_period: 20s

networks:
  factorhouse:
    name: factorhouse
Finally, create a license.env file with your Kpow license details. Then, run the setup script and launch the services:
chmod +x setup.sh
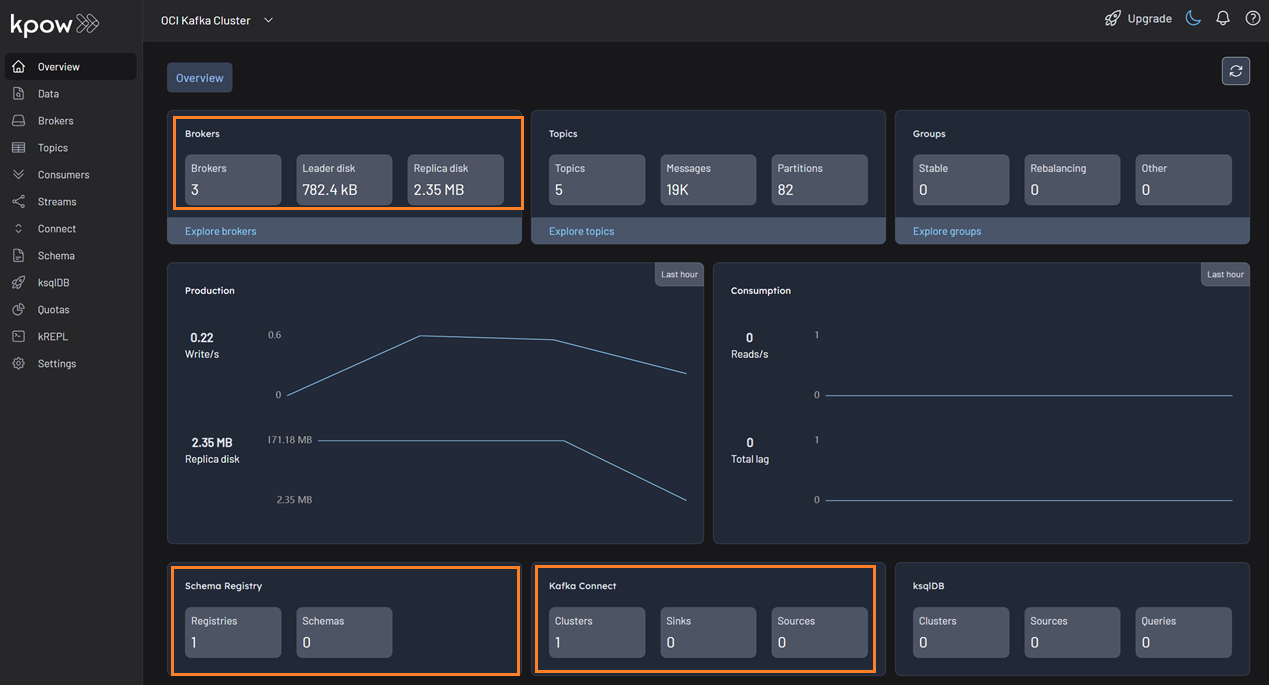
bash setup.sh && docker-compose up -dKpow will now be accessible at http://<vm-ip-address>:3000. You will see an overview of your OCI Kafka cluster, including your self-hosted Kafka Connect and Schema Registry instances.
Deploy Kafka Connector
Now let's deploy a connector to generate some data.
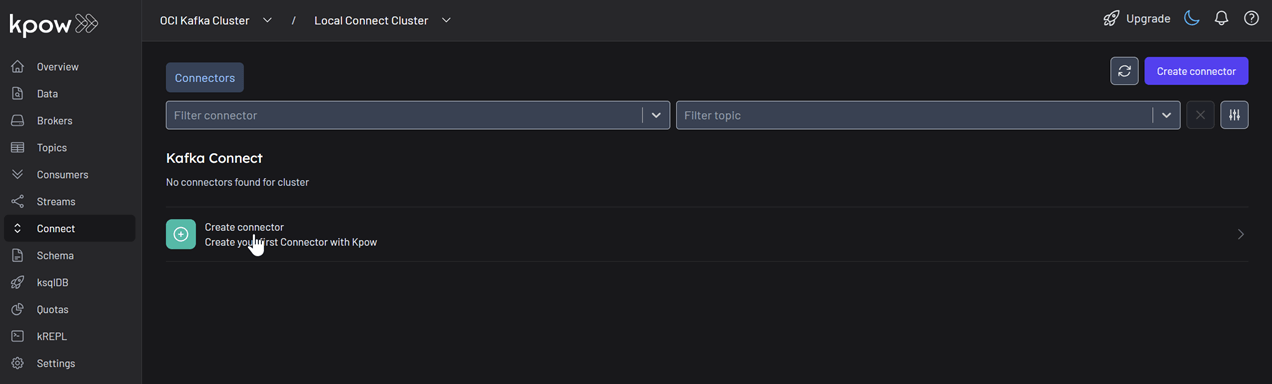
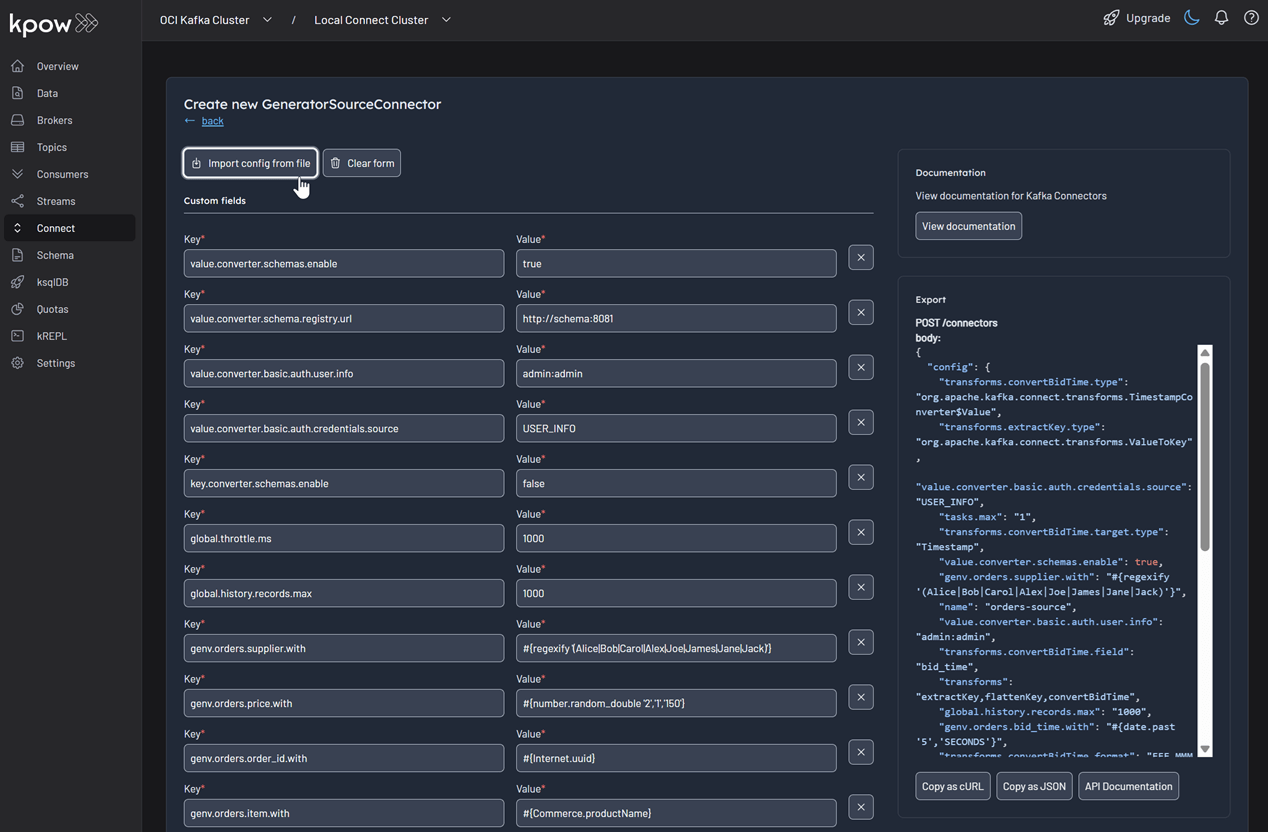
In the Connect menu of the Kpow UI, click the Create connector button.
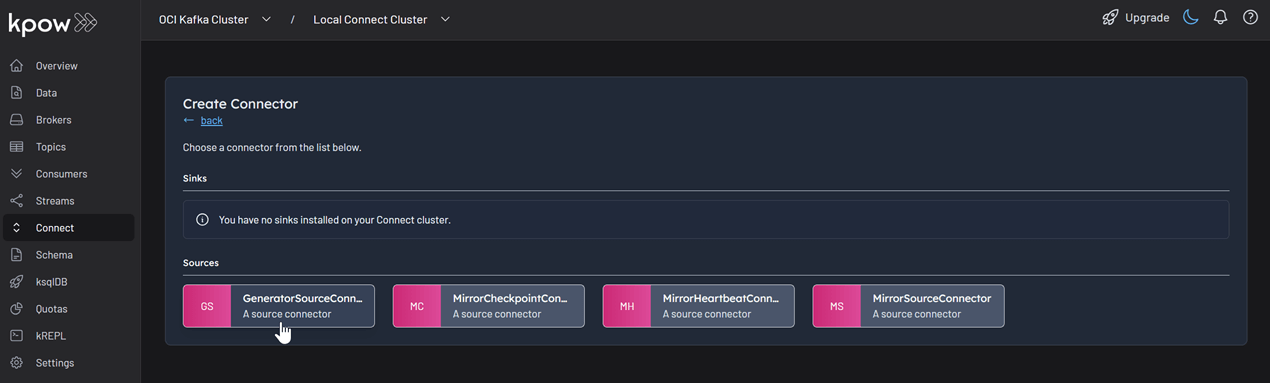
Among the available connectors, select GenerateSourceConnector, which is the source connector that generates fake order records.
Save the following configuration to a Json file, then import it and click Create. This configuration tells the connector to generate order data, use Avro for the value, and apply several Single Message Transforms (SMTs) to shape the final message.
{
  "name": "orders-source",
  "config": {
    "connector.class": "com.amazonaws.mskdatagen.GeneratorSourceConnector",
    "tasks.max": "1",

    "key.converter": "org.apache.kafka.connect.storage.StringConverter",
    "key.converter.schemas.enable": false,
    "value.converter": "io.confluent.connect.avro.AvroConverter",
    "value.converter.schemas.enable": true,
    "value.converter.schema.registry.url": "http://schema:8081",
    "value.converter.basic.auth.credentials.source": "USER_INFO",
    "value.converter.basic.auth.user.info": "admin:admin",

    "genv.orders.order_id.with": "#{Internet.uuid}",
    "genv.orders.bid_time.with": "#{date.past '5','SECONDS'}",
    "genv.orders.price.with": "#{number.random_double '2','1','150'}",
    "genv.orders.item.with": "#{Commerce.productName}",
    "genv.orders.supplier.with": "#{regexify '(Alice|Bob|Carol|Alex|Joe|James|Jane|Jack)'}",

    "transforms": "extractKey,flattenKey,convertBidTime",
    "transforms.extractKey.type": "org.apache.kafka.connect.transforms.ValueToKey",
    "transforms.extractKey.fields": "order_id",
    "transforms.flattenKey.type": "org.apache.kafka.connect.transforms.ExtractField$Key",
    "transforms.flattenKey.field": "order_id",
    "transforms.convertBidTime.type": "org.apache.kafka.connect.transforms.TimestampConverter$Value",
    "transforms.convertBidTime.field": "bid_time",
    "transforms.convertBidTime.target.type": "Timestamp",
    "transforms.convertBidTime.format": "EEE MMM dd HH:mm:ss zzz yyyy",

    "global.throttle.ms": "1000",
    "global.history.records.max": "1000"
  }
}
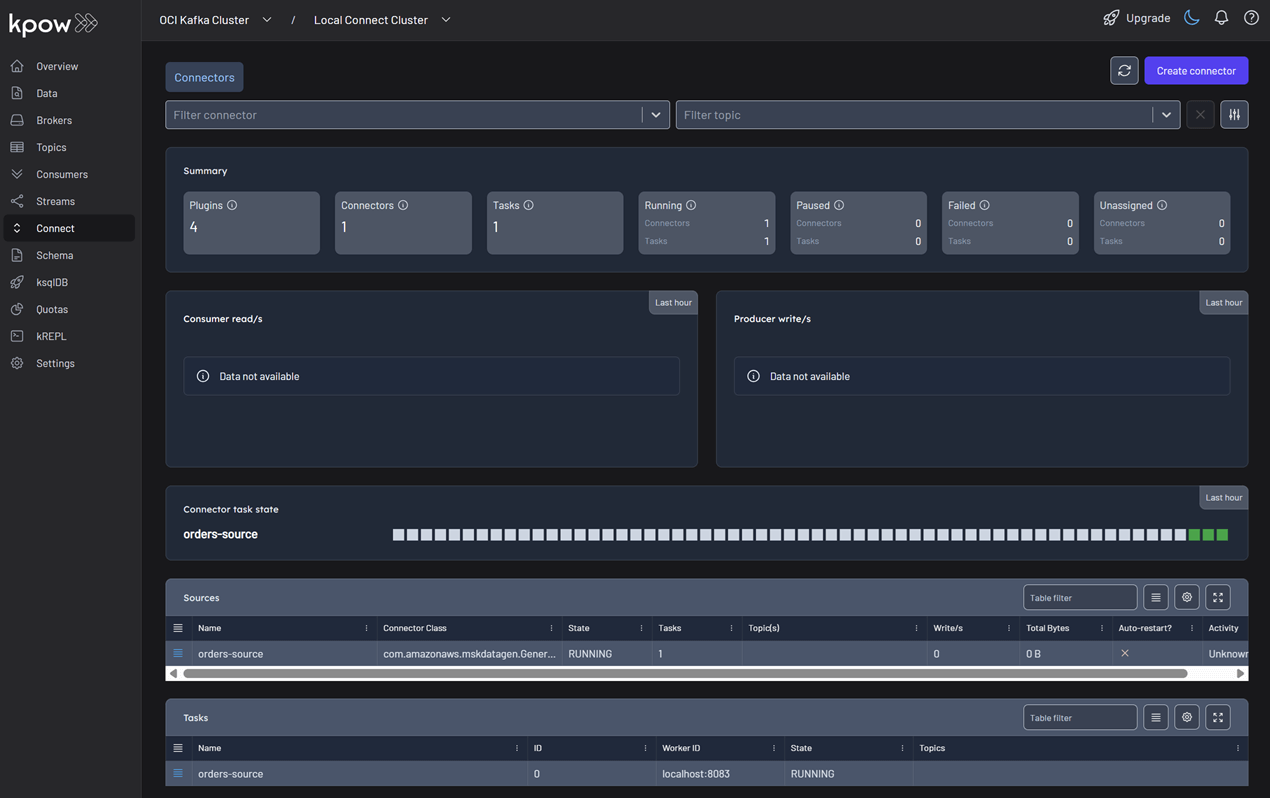
Once deployed, you can see the running connector and its task in the Kpow UI.
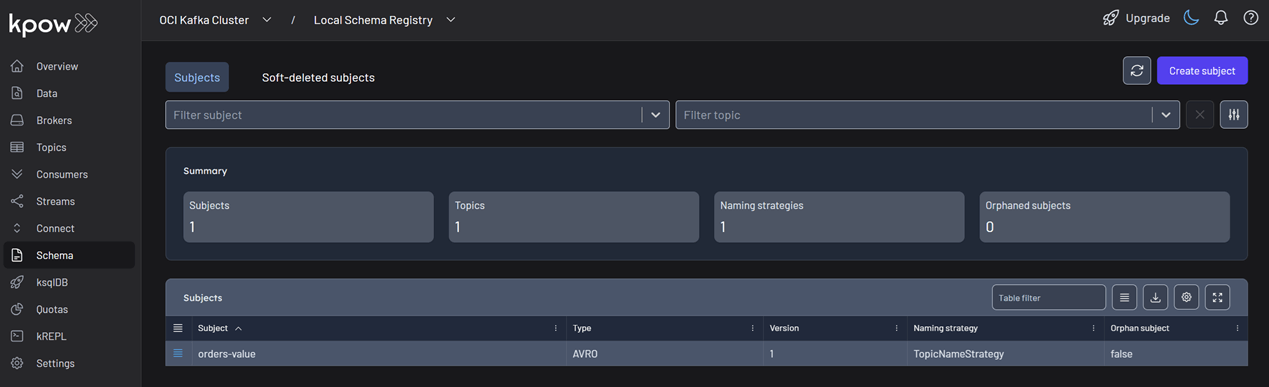
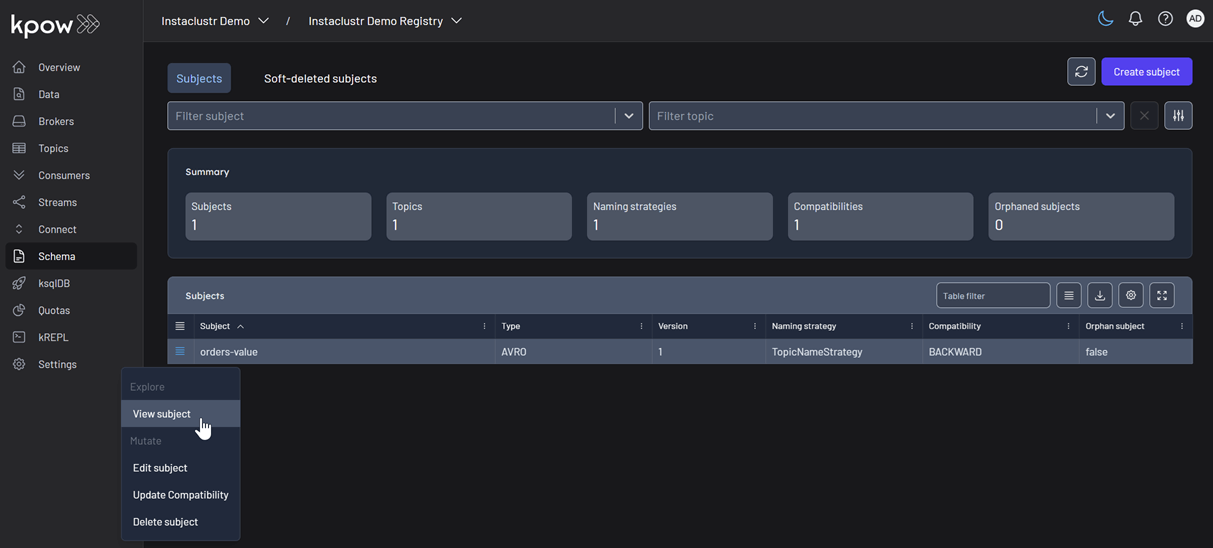
In the Schema menu, you can verify that a new value schema (orders-value) has been registered for the orders topic.
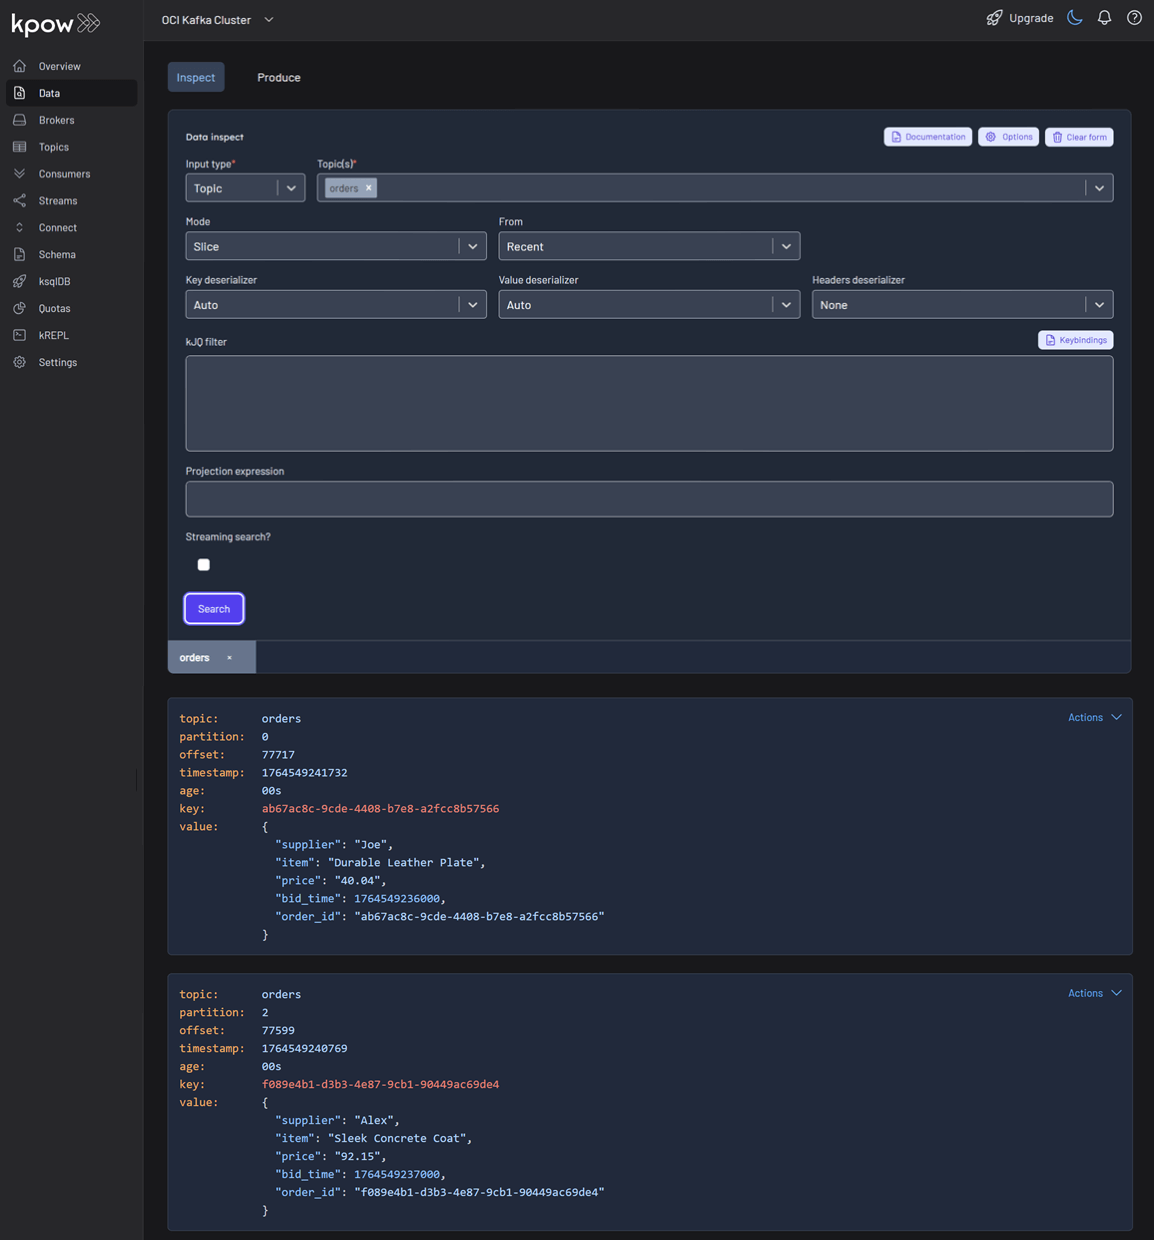
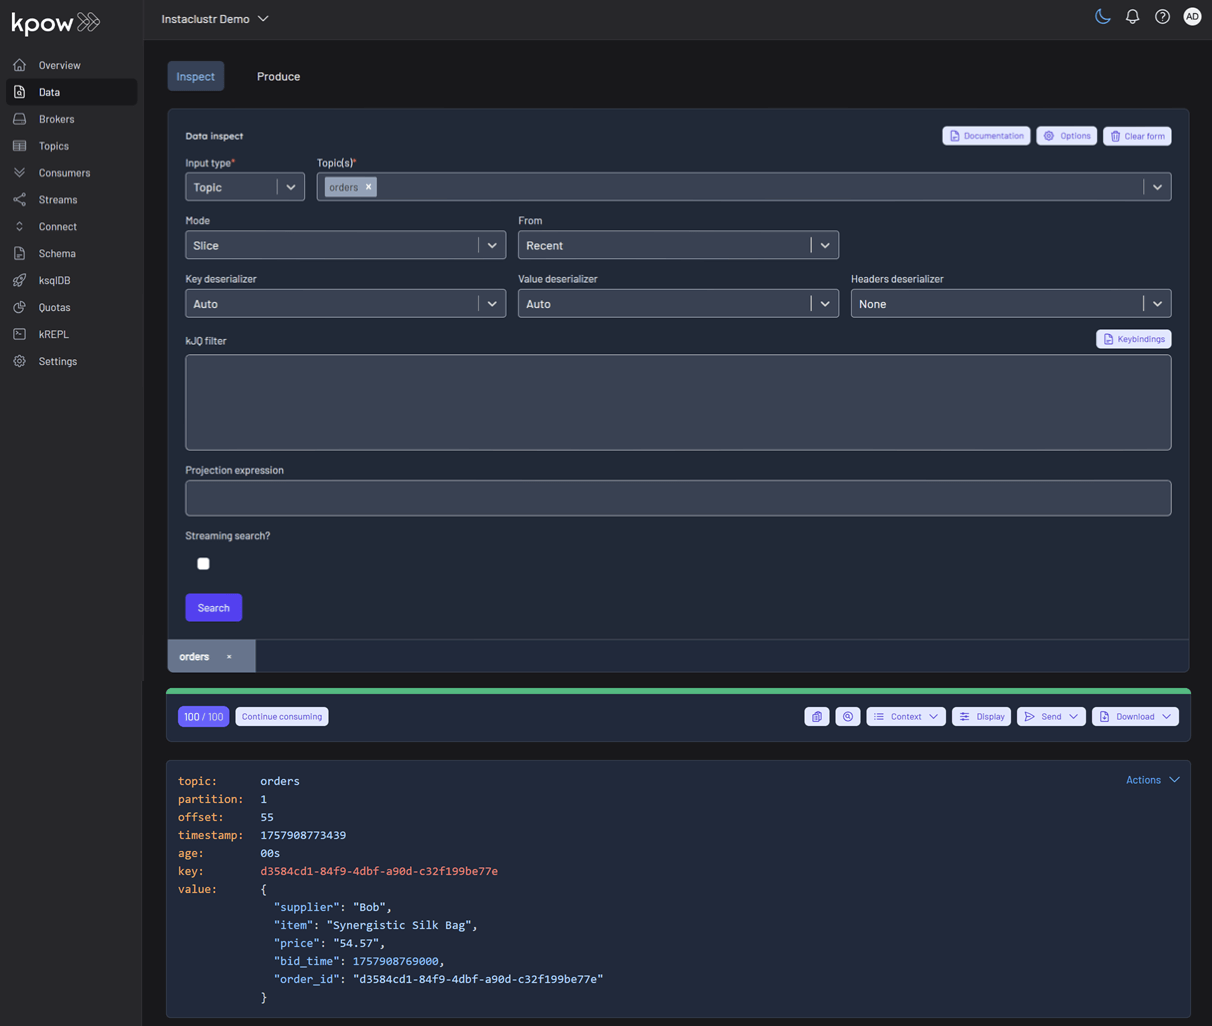
Finally, navigate to Data > Inspect, select the orders topic, and click Search to see the streaming data produced by your new connector.
Conclusion
You have now successfully integrated Kpow with OCI Streaming with Apache Kafka, providing a complete, self-hosted streaming stack on Oracle's powerful cloud infrastructure. By deploying Kafka Connect and Schema Registry alongside your cluster, you have a fully-featured, production-ready environment.
With Kpow, you have gained end-to-end visibility and control, from monitoring broker health and consumer lag to managing schemas, connectors, and inspecting live data streams. This empowers your team to develop, debug, and operate your Kafka-based applications with confidence.
Heading 1
Heading 2
Heading 3
Heading 4
Heading 5
Heading 6
Lorem ipsum dolor sit amet, consectetur adipiscing elit, sed do eiusmod tempor incididunt ut labore et dolore magna aliqua. Ut enim ad minim veniam, quis nostrud exercitation ullamco laboris nisi ut aliquip ex ea commodo consequat. Duis aute irure dolor in reprehenderit in voluptate velit esse cillum dolore eu fugiat nulla pariatur.
Block quote
Ordered list
- Item 1
- Item 2
- Item 3
Unordered list
- Item A
- Item B
- Item C
Bold text
Emphasis
Superscript
Subscript
.webp)
Deploy Kpow on EKS via AWS Marketplace using Helm
Streamline your Kpow deployment on Amazon EKS with our guide, fully integrated with the AWS Marketplace. We use eksctl to automate IAM Roles for Service Accounts (IRSA), providing a secure integration for Kpow's licensing and metering. This allows your instance to handle license validation via AWS License Manager and report usage for hourly subscriptions, enabling a production-ready deployment with minimal configuration.
Overview
This guide provides a comprehensive walkthrough for deploying Kpow, a powerful toolkit for Apache Kafka, onto an Amazon EKS (Elastic Kubernetes Service) cluster. We will cover the entire process from start to finish, including provisioning the necessary AWS infrastructure, deploying a Kafka cluster using the Strimzi operator, and finally, installing Kpow using a subscription from the AWS Marketplace.
The guide demonstrates how to set up both Kpow Annual and Kpow Hourly products, highlighting the specific integration points with AWS services like IAM for service accounts, ECR for container images, and the AWS License Manager for the annual subscription. By the end of this tutorial, you will have a fully functional environment running Kpow on EKS, ready to monitor and manage your Kafka cluster.
The source code and configuration files used in this guide can be found in the features/eks-deployment folder of this GitHub repository.
About Factor House
Factor House is a leader in real-time data tooling, empowering engineers with innovative solutions for Apache Kafka® and Apache Flink®.
Our flagship product, Kpow for Apache Kafka, is the market-leading enterprise solution for Kafka management and monitoring.
Explore our live multi-cluster demo environment or grab a free Community license and dive into streaming tech on your laptop with Factor House Local.

Prerequisites
To follow along the guide, you need:
- CLI Tools:
- AWS Infrastructure:
- VPC: A Virtual Private Cloud (VPC) that has both public and private subnets is required.
- IAM Permissions: A user with the necessary IAM permissions to create an EKS cluster with a service account.
- Kpow Subscription:
- A subscription to a Kpow product through the AWS Marketplace is required. After subscribing, you will receive access to the necessary components and deployment instructions.
- The specifics of accessing the container images and Helm chart depend on the chosen Kpow product:
- Kpow Annual product:
- Subscribing to the annual product provides access to the ECR (Elastic Container Registry) image and the corresponding Helm chart.
- Kpow Hourly product:
- For the hourly product, access to the ECR image will be provided and deployment utilizes the public Factor House Helm repository for installation.
- Kpow Annual product:
Deploy an EKS cluster
We will use eksctl to provision an Amazon EKS cluster. The configuration for the cluster is defined in the manifests/eks/cluster.eksctl.yaml file within the repository.
Before creating the cluster, you must open this file and replace the placeholder values for <VPC-ID>, <PRIVATE-SUBNET-ID-* >, and <PUBLIC-SUBNET-ID-* > with your actual VPC and subnet IDs.
⚠️ The provided configuration assumes the EKS cluster will be deployed in theus-east-1region. If you intend to use a different region, you must update themetadata.regionfield and ensure the availability zone keys undervpc.subnets(e.g.,us-east-1a,us-east-1b) match the availability zones of the subnets in your chosen region.
Here is the content of the cluster.eksctl.yaml file:
apiVersion: eksctl.io/v1alpha5
kind: ClusterConfig

metadata:
  name: fh-eks-cluster
  region: us-east-1

vpc:
  id: "<VPC-ID>"
  subnets:
    private:
      us-east-1a:
        id: "<PRIVATE-SUBNET-ID-1>"
      us-east-1b:
        id: "<PRIVATE-SUBNET-ID-2>"
    public:
      us-east-1a:
        id: "<PUBLIC-SUBNET-ID-1>"
      us-east-1b:
        id: "<PUBLIC-SUBNET-ID-2>"

iam:
  withOIDC: true
  serviceAccounts:
    - metadata:
        name: kpow-annual
        namespace: factorhouse
      attachPolicyARNs:
        - "arn:aws:iam::aws:policy/service-role/AWSLicenseManagerConsumptionPolicy"
    - metadata:
        name: kpow-hourly
        namespace: factorhouse
      attachPolicyARNs:
        - "arn:aws:iam::aws:policy/AWSMarketplaceMeteringRegisterUsage"

nodeGroups:
  - name: ng-dev
    instanceType: t3.medium
    desiredCapacity: 4
    minSize: 2
    maxSize: 6
    privateNetworking: true
This configuration sets up the following:
- Cluster Metadata: A cluster named
fh-eks-clusterin theus-east-1region. - VPC: Specifies an existing VPC and its public/private subnets where the cluster resources will be deployed.
- IAM with OIDC: Enables the IAM OIDC provider, which allows Kubernetes service accounts to be associated with IAM roles. This is crucial for granting AWS permissions to your pods.
- Service Accounts:
kpow-annual: Creates a service account for the Kpow Annual product. It attaches theAWSLicenseManagerConsumptionPolicy, allowing Kpow to validate its license with the AWS License Manager service.kpow-hourly: Creates a service account for the Kpow Hourly product. It attaches theAWSMarketplaceMeteringRegisterUsagepolicy, which is required for reporting usage metrics to the AWS Marketplace.
- Node Group: Defines a managed node group named
ng-devwitht3.mediuminstances. The worker nodes will be placed in the private subnets (privateNetworking: true).
Once you have updated the YAML file with your networking details, run the following command to create the cluster. This process can take 15-20 minutes to complete.
eksctl create cluster -f cluster.eksctl.yamlOnce the cluster is created, eksctl automatically updates your kubeconfig file (usually located at ~/.kube/config) with the new cluster's connection details. This allows you to start interacting with your cluster immediately using kubectl.
kubectl get nodes
# NAME                              STATUS   ROLES    AGE     VERSION
# ip-192-168-...-21.ec2.internal   Ready    <none>   2m15s    v1.32.9-eks-113cf36
# ...
Launch a Kafka cluster
With the EKS cluster running, we will now launch an Apache Kafka cluster into it. We will use the Strimzi Kafka operator, which simplifies the process of running Kafka on Kubernetes.
Install the Strimzi operator
First, create a dedicated namespace for the Kafka cluster.
kubectl create namespace kafka
Next, download the Strimzi operator installation YAML. The repository already contains the file manifests/kafka/strimzi-cluster-operator-0.45.1.yaml, but the following commands show how it was downloaded and modified for this guide.
## Define the Strimzi version and download URL
STRIMZI_VERSION="0.45.1"
DOWNLOAD_URL=https://github.com/strimzi/strimzi-kafka-operator/releases/download/$STRIMZI_VERSION/strimzi-cluster-operator-$STRIMZI_VERSION.yaml

## Download the operator manifest
curl -L -o manifests/kafka/strimzi-cluster-operator-$STRIMZI_VERSION.yaml ${DOWNLOAD_URL}

## Modify the manifest to install the operator in the 'kafka' namespace
sed -i 's/namespace: .*/namespace: kafka/' manifests/kafka/strimzi-cluster-operator-$STRIMZI_VERSION.yaml
Now, apply the manifest to install the Strimzi operator in your EKS cluster.
kubectl apply -f manifests/kafka/strimzi-cluster-operator-0.45.1.yaml -n kafkaDeploy a Kafka cluster
The configuration for our Kafka cluster is defined in manifests/kafka/kafka-cluster.yaml. It describes a simple, single-node cluster suitable for development, using ephemeral storage, meaning data will be lost if the pods restart.
apiVersion: kafka.strimzi.io/v1beta2
kind: Kafka
metadata:
  name: fh-k8s-cluster
spec:
  kafka:
    version: 3.9.1
    replicas: 1
    listeners:
      - name: plain
        port: 9092
        type: internal
        tls: false
# ... (content truncated for brevity)
Deploy the Kafka cluster with the following command:
kubectl create -f manifests/kafka/kafka-cluster.yaml -n kafkaVerify the deployment
After a few minutes, all the necessary pods and services for Kafka will be running. You can verify this by listing all resources in the kafka namespace.
kubectl get all -n kafka -o nameThe output should look similar to this, showing the pods for Strimzi, Kafka, Zookeeper, and the associated services. The most important service for connecting applications is the Kafka bootstrap service.
# pod/fh-k8s-cluster-entity-operator-...
# pod/fh-k8s-cluster-kafka-0
# ...
# service/fh-k8s-cluster-kafka-bootstrap <-- Kafka bootstrap service
# ...
Deploy Kpow
Now that the EKS and Kafka clusters are running, we can deploy Kpow. This guide covers the deployment of both Kpow Annual and Kpow Hourly products. Both deployments will use a common set of configurations for connecting to Kafka and setting up authentication/authorization.
First, ensure you have a namespace for Kpow. The eksctl command we ran earlier already created the service accounts in the factorhouse namespace, so we will use that. If you hadn't created it, you would run kubectl create namespace factorhouse.
Create ConfigMaps
We will use two Kubernetes ConfigMaps to manage Kpow's configuration. This approach separates the core configuration from the Helm deployment values.
kpow-config-files: This ConfigMap holds file-based configurations, including RBAC policies, JAAS configuration, and user properties for authentication.kpow-config: This ConfigMap provides environment variables to the Kpow container, such as the Kafka bootstrap address and settings to enable our authentication provider.
The contents of these files can be found in the repository at manifests/kpow/config-files.yaml and manifests/kpow/config.yaml.
manifests/kpow/config-files.yaml
apiVersion: v1
kind: ConfigMap
metadata:
  name: kpow-config-files
  namespace: factorhouse
data:
  hash-rbac.yml: |
    # RBAC policies defining user roles and permissions
    admin_roles:
      - "kafka-admins"
    # ... (content truncated for brevity)
  hash-jaas.conf: |
    # JAAS login module configuration
    kpow {
      org.eclipse.jetty.jaas.spi.PropertyFileLoginModule required
      file="/etc/kpow/jaas/hash-realm.properties";
    };
    # ... (content truncated for brevity)
  hash-realm.properties: |
    # User credentials (username: password, roles)
    # admin/admin
    admin: CRYPT:adpexzg3FUZAk,server-administrators,content-administrators,kafka-admins
    # user/password
    user: password,kafka-users
    # ... (content truncated for brevity)
manifests/kpow/config.yaml
apiVersion: v1
kind: ConfigMap
metadata:
  name: kpow-config
  namespace: factorhouse
data:
  # Environment Configuration
  BOOTSTRAP: "fh-k8s-cluster-kafka-bootstrap.kafka.svc.cluster.local:9092"
  REPLICATION_FACTOR: "1"
  # AuthN + AuthZ
  JAVA_TOOL_OPTIONS: "-Djava.awt.headless=true -Djava.security.auth.login.config=/etc/kpow/jaas/hash-jaas.conf"
  AUTH_PROVIDER_TYPE: "jetty"
  RBAC_CONFIGURATION_FILE: "/etc/kpow/rbac/hash-rbac.yml"
Apply these manifests to create the ConfigMaps in the factorhouse namespace.
kubectl apply -f manifests/kpow/config-files.yaml \
  -f manifests/kpow/config.yaml -n factorhouse
You can verify their creation by running:
kubectl get configmap -n factorhouse
# NAME                DATA   AGE
# kpow-config         5      ...
# kpow-config-files   3      ...
Deploy Kpow Annual
Download the Helm chart
The Helm chart for Kpow Annual is in a private Amazon ECR repository. First, authenticate your Helm client.
# Enable Helm's experimental support for OCI registries
export HELM_EXPERIMENTAL_OCI=1

# Log in to the AWS Marketplace ECR registry
aws ecr get-login-password \
    --region us-east-1 | helm registry login \
    --username AWS \
    --password-stdin 709825985650.dkr.ecr.us-east-1.amazonaws.com
Next, pull and extract the chart.
# Create a directory, pull the chart, and extract it
mkdir -p awsmp-chart && cd awsmp-chart
# Pull the latest version of the Helm chart from ECR (add --version <x.x.x> to specify a version)
helm pull oci://709825985650.dkr.ecr.us-east-1.amazonaws.com/factor-house/kpow-aws-annual
tar xf $(pwd)/* && find $(pwd) -maxdepth 1 -type f -delete
cd ..
Launch Kpow Annual
Now, install Kpow using Helm. We will reference the service account kpow-annual that was created during the EKS cluster setup, which has the required IAM policy for license management.
helm install kpow-annual ./awsmp-chart/kpow-aws-annual/ \
    -n factorhouse \
    --set serviceAccount.create=false \
    --set serviceAccount.name=kpow-annual \
    --values ./values/eks-annual.yaml
The Helm values for this deployment are in values/eks-annual.yaml. It mounts the configuration files from our ConfigMaps and sets resource limits.
# values/eks-annual.yaml
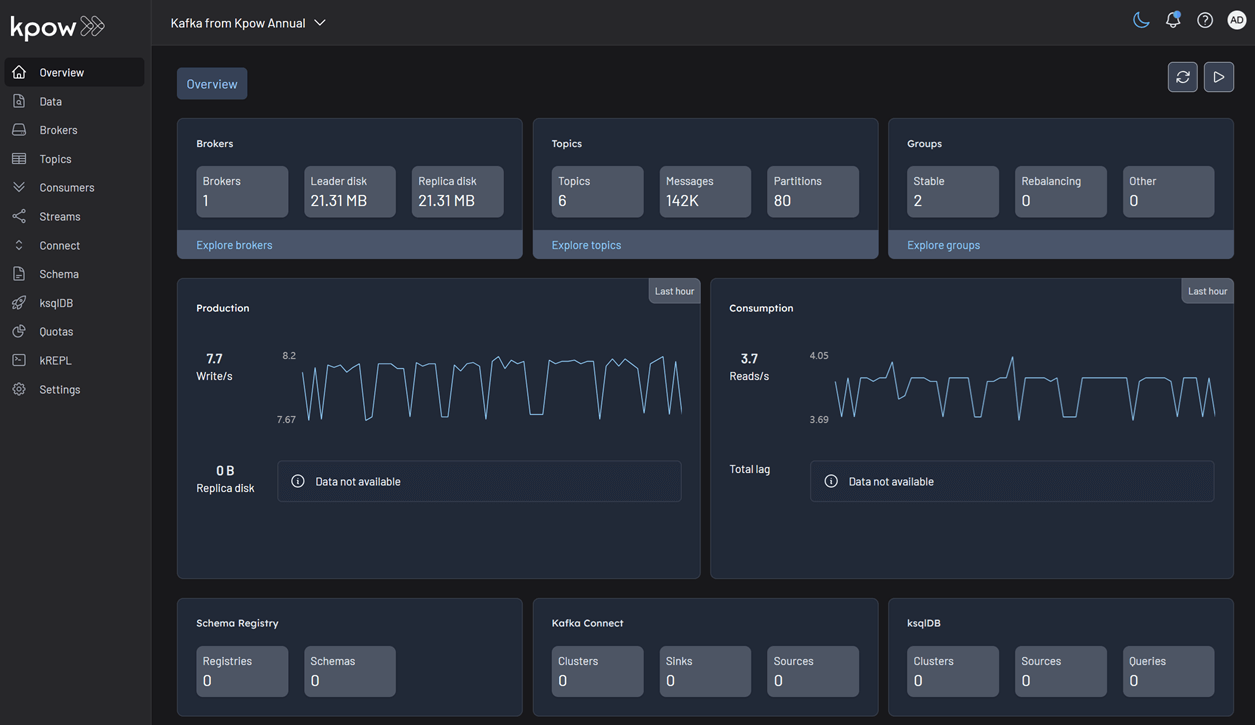
env:
ENVIRONMENT_NAME: "Kafka from Kpow Annual"
envFromConfigMap: "kpow-config"
volumeMounts:
- name: kpow-config-volumes
mountPath: /etc/kpow/rbac/hash-rbac.yml
subPath: hash-rbac.yml
- name: kpow-config-volumes
mountPath: /etc/kpow/jaas/hash-jaas.conf
subPath: hash-jaas.conf
- name: kpow-config-volumes
mountPath: /etc/kpow/jaas/hash-realm.properties
subPath: hash-realm.properties
volumes:
- name: kpow-config-volumes
configMap:
name: "kpow-config-files"
resources:
limits:
cpu: 1
memory: 0.5Gi
requests:
cpu: 1
memory: 0.5GiNote: The CPU and memory values are intentionally set low for this guide. For production environments, check the official documentation for recommended capacity.
Verify and access Kpow Annual
Check that the Kpow pod is running successfully.
kubectl get all -l app.kubernetes.io/instance=kpow-annual -n factorhouse
# NAME                                              READY   STATUS    RESTARTS   AGE
# pod/kpow-annual-kpow-aws-annual-c6bc849fb-zw5ww   0/1     Running   0          46s

# NAME                                  TYPE        CLUSTER-IP       EXTERNAL-IP   PORT(S)    AGE
# service/kpow-annual-kpow-aws-annual   ClusterIP   10.100.220.114   <none>        3000/TCP   47s
# ...
To access the UI, forward the service port to your local machine.
kubectl -n factorhouse port-forward service/kpow-annual-kpow-aws-annual 3000:3000You can now access Kpow by navigating to http://localhost:3000 in your browser.
Deploy Kpow Hourly
Configure the Kpow Helm repository
The Helm chart for Kpow Hourly is available in the Factor House Helm repository. First, add the Helm repository.
helm repo add factorhouse https://charts.factorhouse.ioNext, update Helm repositories to ensure you install the latest version of Kpow.
helm repo updateLaunch Kpow Hourly
Install Kpow using Helm, referencing the kpow-hourly service account which has the IAM policy for marketplace metering.
helm install kpow-hourly factorhouse/kpow-aws-hourly \
  -n factorhouse \
  --set serviceAccount.create=false \
  --set serviceAccount.name=kpow-hourly \
  --values ./values/eks-hourly.yaml
The Helm values are defined in values/eks-hourly.yaml.
# values/eks-hourly.yaml
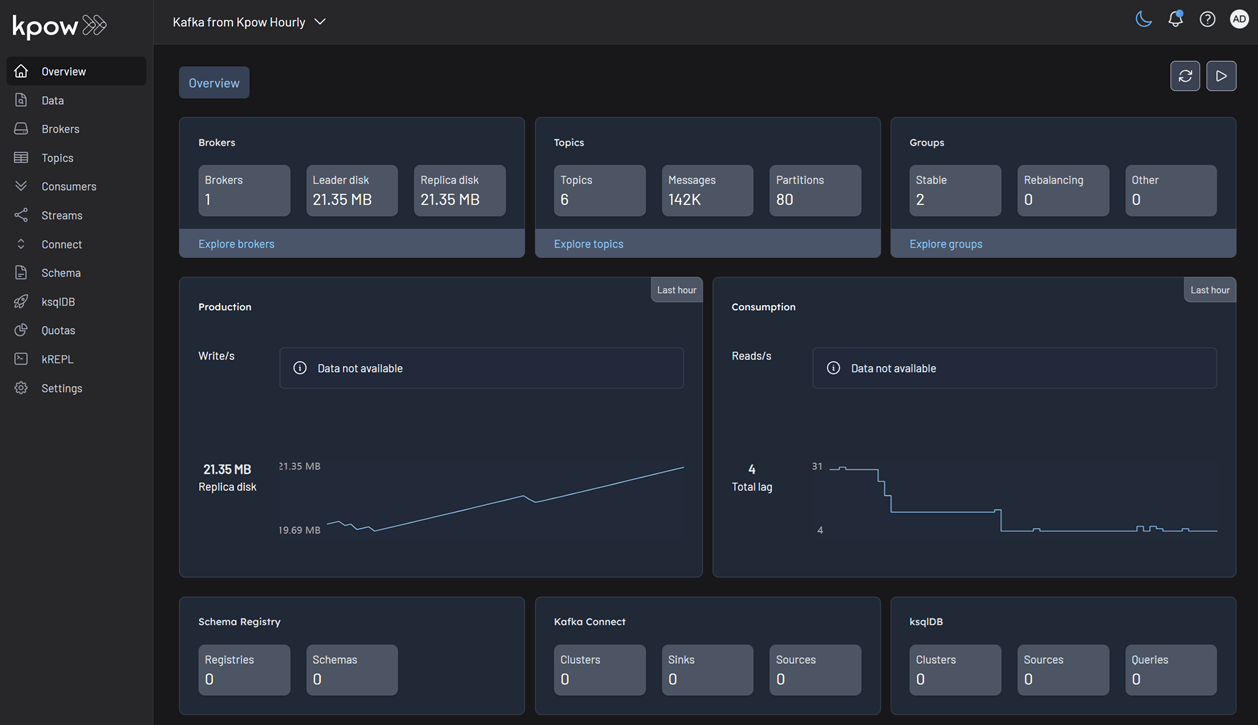
env:
ENVIRONMENT_NAME: "Kafka from Kpow Hourly"
envFromConfigMap: "kpow-config"
volumeMounts:
# ... (volume configuration is the same as annual)
volumes:
# ...
resources:
# ...Verify and access Kpow Hourly
Check that the Kpow pod is running.
kubectl get all -l app.kubernetes.io/instance=kpow-hourly -n factorhouse
# NAME                                               READY   STATUS    RESTARTS   AGE
# pod/kpow-hourly-kpow-aws-hourly-68869b6cb9-x9prf   0/1     Running   0          83s

# NAME                                  TYPE        CLUSTER-IP      EXTERNAL-IP   PORT(S)    AGE
# service/kpow-hourly-kpow-aws-hourly   ClusterIP   10.100.221.36   <none>        3000/TCP   85s
# ...
To access the UI, forward the service port to a different local port (e.g., 3001) to avoid conflicts.
kubectl -n factorhouse port-forward service/kpow-hourly-kpow-aws-hourly 3001:3000You can now access Kpow by navigating to http://localhost:3001 in your browser.
Delete resources
To avoid ongoing AWS charges, clean up all created resources in reverse order.
Delete Kpow and ConfigMaps
helm uninstall kpow-annual kpow-hourly -n factorhouse
kubectl delete -f manifests/kpow/config-files.yaml \
  -f manifests/kpow/config.yaml -n factorhouse
Delete the Kafka cluster and Strimzi operator
STRIMZI_VERSION="0.45.1"
kubectl delete -f manifests/kafka/kafka-cluster.yaml -n kafka
kubectl delete -f manifests/kafka/strimzi-cluster-operator-$STRIMZI_VERSION.yaml -n kafka
Delete the EKS cluster
This command will remove the cluster and all associated resources.
eksctl delete cluster -f manifests/eks/cluster.eksctl.yamlConclusion
In this guide, we have successfully deployed a complete, production-ready environment for monitoring Apache Kafka on AWS. By leveraging eksctl, we provisioned a robust EKS cluster with correctly configured IAM roles for service accounts, a critical step for secure integration with AWS services. We then deployed a Kafka cluster using the Strimzi operator, demonstrating the power of Kubernetes operators in simplifying complex stateful applications.
Finally, we walked through the deployment of both Kpow Annual and Kpow Hourly from the AWS Marketplace. This showcased the flexibility of Kpow's subscription models and their seamless integration with AWS for licensing and metering. You are now equipped with the knowledge to set up, configure, and manage Kpow on EKS, unlocking powerful insights and operational control over your Kafka ecosystem.
Heading 1
Heading 2
Heading 3
Heading 4
Heading 5
Heading 6
Lorem ipsum dolor sit amet, consectetur adipiscing elit, sed do eiusmod tempor incididunt ut labore et dolore magna aliqua. Ut enim ad minim veniam, quis nostrud exercitation ullamco laboris nisi ut aliquip ex ea commodo consequat. Duis aute irure dolor in reprehenderit in voluptate velit esse cillum dolore eu fugiat nulla pariatur.
Block quote
Ordered list
- Item 1
- Item 2
- Item 3
Unordered list
- Item A
- Item B
- Item C
Bold text
Emphasis
Superscript
Subscript
.webp)
Set Up Kpow with Instaclustr Platform
This guide demonstrates how to set up Kpow with Instaclustr using a practical example. We deploy a Kafka cluster with the Karapace Schema Registry add-on and a Kafka Connect cluster, then use Kpow to deploy custom connectors and manage an end-to-end data pipeline.
Overview
Instaclustr provides a robust, managed platform for Apache Kafka, handling the complex operational overhead of running a distributed streaming ecosystem. While the platform ensures reliability and scalability, developers and operators still need a powerful tool for monitoring, managing, and interacting with their Kafka resources. This is where Kpow, the all-in-one toolkit for Kafka, shines.
In this guide, we will walk through the complete process of setting up Kpow to connect to and manage a Kafka environment hosted on Instaclustr. We will begin by provisioning a Kafka cluster with Karapace Schema registry and Kafka Connect cluster. Then, we will configure and launch a local Kpow instance, detailing how to gather the correct connection information from the Instaclustr console. To put this integration into practice, we will use Kpow's interface to deploy a full data pipeline, demonstrating how to manage custom connectors, inspect topic data, and view schemas in real-time. By the end of this tutorial, we will have a fully operational Kpow instance providing a comprehensive view and powerful control over our managed Instaclustr environment.
</> The source code and configuration files used in this tutorial can be found in the integrations/instaclustr-getting-started directory of the examples GitHub repository.examples GitHub repository. GitHub repository.💡 Kpow can be integrated with a wide range of managed Kafka services. See the following guides for more details.
- Set Up Kpow with Confluent Cloud
- Set Up Kpow with Amazon Managed Streaming for Apache Kafka
- Set Up Kpow with Google Cloud Managed Service for Apache Kafka
- Integrate Kpow with Bufstream
About Factor House
Factor House is a leader in real-time data tooling, empowering engineers with innovative solutions for Apache Kafka® and Apache Flink®.
Our flagship product, Kpow for Apache Kafka, is the market-leading enterprise solution for Kafka management and monitoring.
Explore our live multi-cluster demo environment or grab a free Community license and dive into streaming tech on your laptop with Factor House Local.
Preparing deployment of custom Kafka connectors
Deploying S3 buckets and create an IAM user
To begin, we'll provision the necessary AWS resources using a CloudFormation template. This template will create two S3 buckets and an IAM user with the appropriate permissions.
AWSTemplateFormatVersion: "2010-09-09"

Parameters:
  ResourceNamePrefixParameter:
    Type: String
    Default: fh-instaclustr
    AllowedPattern: "[a-z0-9\\-]+"
    Description: Custom connector AWS storage resources name prefix

Resources:
  InstaclustrKafkaConnectCustomConnectorsBucket:
    Type: AWS::S3::Bucket
    Properties:
      BucketName: !Sub "${ResourceNamePrefixParameter}-custom-connector"

  InstaclustrKafkaConnectSinkBucket:
    Type: AWS::S3::Bucket
    Properties:
      BucketName: !Sub "${ResourceNamePrefixParameter}-sink"

  InstaclustrCustomConnectorPullUser:
    Type: AWS::IAM::User
    Properties:
      UserName: !Sub "${ResourceNamePrefixParameter}-user"

  InstaclustrCustomConnectorUserAccessPolicy:
    Type: AWS::IAM::Policy
    Properties:
      PolicyName: !Sub "${ResourceNamePrefixParameter}-policy"
      PolicyDocument:
        Version: "2012-10-17"
        Statement:
          - Effect: Allow
            Action:
              - s3:ListBucket
              - s3:GetBucketLocation
            Resource:
              - !GetAtt InstaclustrKafkaConnectCustomConnectorsBucket.Arn
              - !GetAtt InstaclustrKafkaConnectSinkBucket.Arn

          - Effect: Allow
            Action:
              - s3:GetObject
            Resource: !Sub "${InstaclustrKafkaConnectCustomConnectorsBucket.Arn}/*"

          - Effect: Allow
            Action:
              - s3:PutObject
              - s3:GetObject
              - s3:AbortMultipartUpload
              - s3:DeleteObject
              - s3:ListMultipartUploadParts
            Resource: !Sub "${InstaclustrKafkaConnectSinkBucket.Arn}/*"
      Users:
        - !Ref InstaclustrCustomConnectorPullUser

Outputs:
  CustomConnectorS3BucketName:
    Value: !Ref InstaclustrKafkaConnectCustomConnectorsBucket
    Description: Name of S3 bucket to hold custom connector JARs

  SinkS3BucketName:
    Value: !Ref InstaclustrKafkaConnectSinkBucket
    Description: Name of S3 bucket for the S3 sink connector to write data to
The CloudFormation stack will create the following resources:
<prefix>-custom-connector: An S3 bucket designated for uploading our custom Kafka connector artifacts. The default name isfh-instaclustr-custom-connector.<prefix>-sink: A second S3 bucket that will serve as the destination for records from our Kafka topic. The default name isfh-instaclustr-sink.<prefix>-user: An IAM user with read access to the connector source bucket and read/write permissions for the sink S3 bucket. The default username isfh-instaclustr-user.
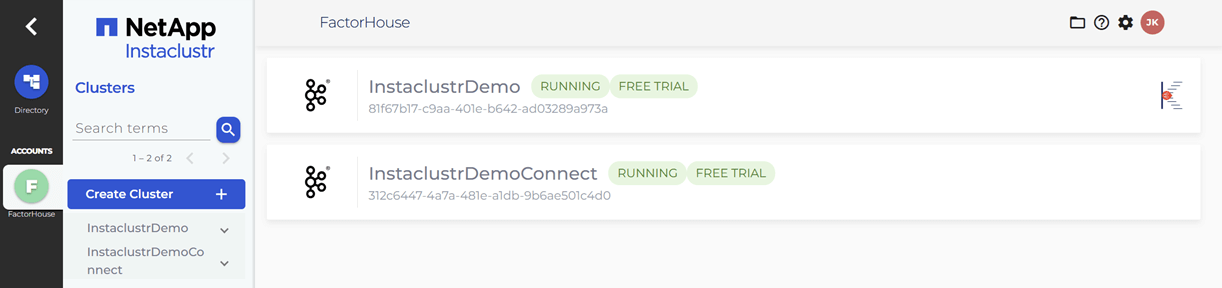
Create Kafka and Kafka Connect clusters
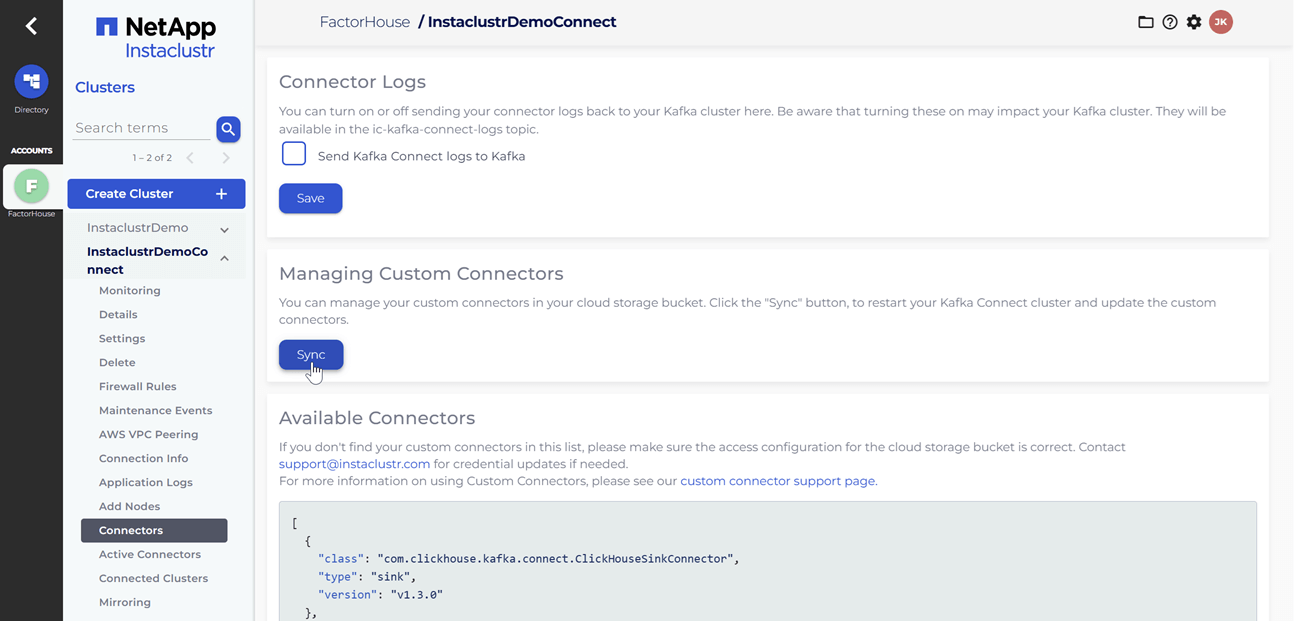
Within the Instaclustr console, we will create a Kafka cluster. For this demonstration, we will include the Karapace schema registry as an enterprise add-on. When creating the Kafka Connect cluster, we must ensure that we select the previously created Kafka cluster as the target. It is also crucial that we enable the Use custom connectors option. This will present a configuration form where we can provide the name of the S3 bucket containing our connector artifacts and the necessary AWS credentials. For more detailed instructions, please refer to the official Instaclustr documentation.
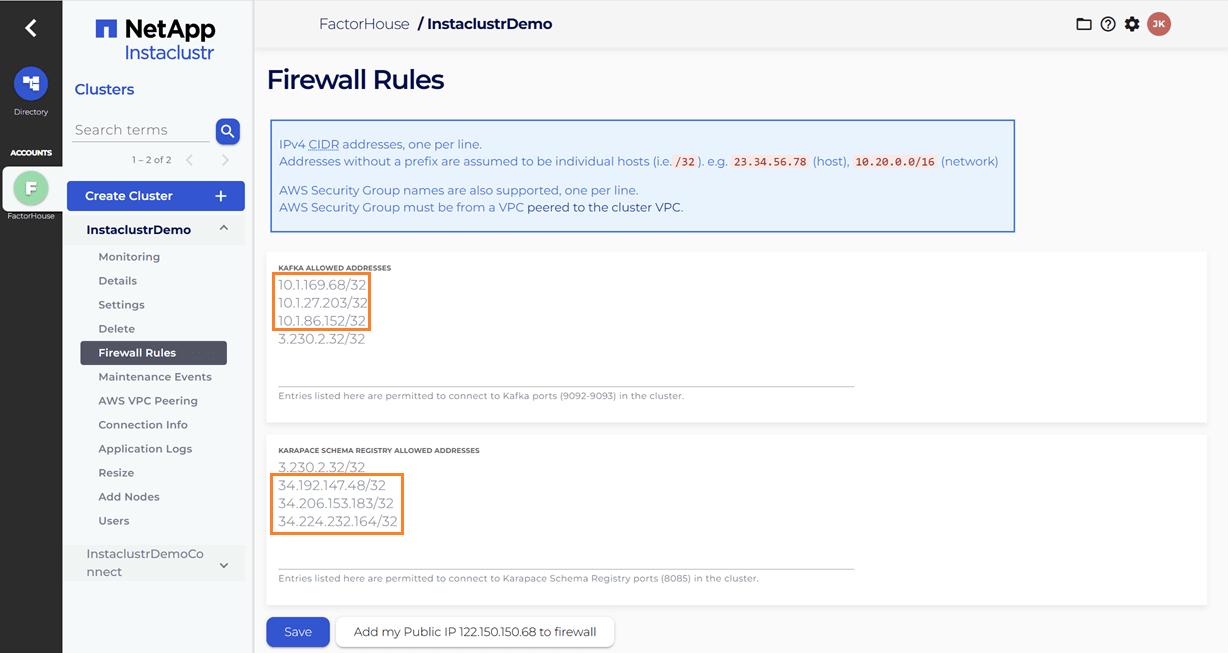
Update firewall rules
When we link the Kafka Connect cluster to the target Kafka cluster, the firewall rules for the Kafka cluster are automatically updated to include the IP addresses of the Kafka Connect cluster. However, the firewall rules for the Karapace schema registry are not automatically adjusted. We will need to manually add the public IP addresses of the Kafka Connect cluster to the Karapace schema registry's allowed addresses. It appears that the connection from the Kafka Connect cluster to the schema registry is established over public IPs.
Upload Kafka connect artifacts to S3
Next, we will upload two custom Kafka connectors to the newly created S3 bucket. A shell script is provided to streamline this process.
./integrations/instaclustr-getting-started/connector/upload-connectors.sh <bucket-name>

# ▶️  Downloading and syncing Kafka connector artifacts to s3://<bucket-name>/
# ⏳ Progress : [##################################################] 100%✅ Sync complete!
#
# ✅ Download complete in 0m 29s!
After the artifacts are uploaded to the S3 bucket, we will navigate to our Kafka Connect cluster in the Instaclustr console and click the Sync button. This action triggers the download of the connector artifacts to the Connect cluster.
Deploy Kpow instance
Once our Kafka and Kafka Connect clusters are running, we can initiate a Kpow instance using Docker. The configuration details required for Kpow to connect to our Instaclustr-managed Kafka environment are outlined below.
The setup.env file is crucial for establishing the connection between Kpow and our Kafka ecosystem on Instaclustr. Here's a detailed guide on how we can populate this file with the correct information sourced from the Instaclustr console:
- Kafka Cluster: The bootstrap server addresses, which are the public IP addresses of our Kafka brokers, can be found on the Connection Info page of our Kafka cluster. This page also provides the necessary username and password. These values should be assigned to the
BOOTSTRAPandSASL_JAAS_CONFIGvariables, respectively. - Schema Registry: For the Schema Registry connection, we will need the URL that is secured with a CA-signed certificate. This URL, along with the required username and password, is also available on the Connection Info page for our Schema Registry service.
- Kafka Connect Cluster: The configuration for our Kafka Connect cluster requires its public IP address for the
CONNECT_REST_URL. The credentials (username and password) for the Connect cluster can be found on its respective Connection Info page and should be used in the connection configuration.
💡 To enable a connection from our local machine to the Kafka resources, it is essential to add our IP address to the Firewall Rules within the Instaclustr console for our cluster.
## Kafka environments
ENVIRONMENT_NAME=Instaclustr Demo
BOOTSTRAP=<KAFKA-IP1>:9092,<KAFKA-IP2>:9092,<KAFKA-IP3>:9092
SECURITY_PROTOCOL=SASL_PLAINTEXT
SASL_MECHANISM=SCRAM-SHA-256
SASL_JAAS_CONFIG=org.apache.kafka.common.security.scram.ScramLoginModule required username="<KAFKA_USERNAME>" password="<KAFKA_PASSWORD>";
CONNECT_NAME=Instaclustr Demo Cluster
CONNECT_REST_URL=https://<KAFKA-CONNECT-IP1>:8083
CONNECT_PERMISSIVE_SSL=true
CONNECT_AUTH=BASIC
CONNECT_BASIC_AUTH_USER=<KAFKA_CONNECT_USERNAME>
CONNECT_BASIC_AUTH_PASS=<KAFKA_CONNECT_PASSWORD>
SCHEMA_REGISTRY_NAME=Instaclustr Demo Registry
SCHEMA_REGISTRY_URL=https://<REGISTRY_URL_WITH_AN_ASSOCIATED_CA_SIGNED_CERTIFICATE>:8085
SCHEMA_REGISTRY_AUTH=USER_INFO
SCHEMA_REGISTRY_USER=<SCHEMA_REGISTRY_USERNAME>
SCHEMA_REGISTRY_PASSWORD=<SCHEMA_REGISTRY_PASSWORD>
To launch Kpow, we execute the following Docker command. Ensure that a valid Kpow license file is located at ./kpow/config/license.env.
docker run -d -p 3000:3000 --name kpow \
--env-file=./kpow/config/setup.env \
--env-file=./kpow/config/license.env \
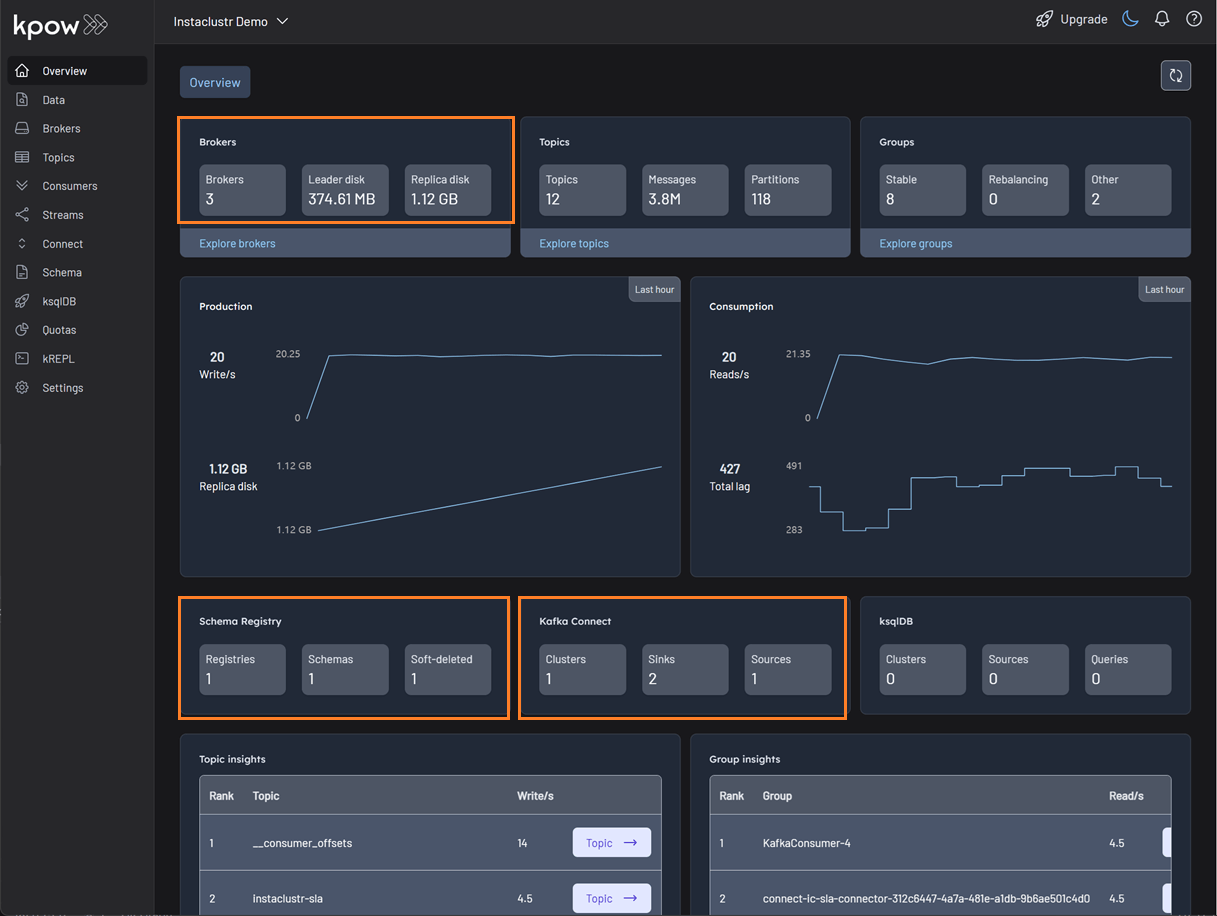
factorhouse/kpow-ce:latestOnce running, Kpow will be accessible at http://<ip-address>:3000. The user interface should confirm the successful discovery of our three Kafka brokers, the Schema Registry, and the Kafka Connect cluster.
Deploying Kafka connectors
We are now ready to deploy our connectors using Kpow's interface. We will start with the source connector to generate data and then deploy the sink connector to write that data to S3.
Deploying the source connector (MSK data generator)
From the Connect menu in the Kpow UI, click the Create connector button.
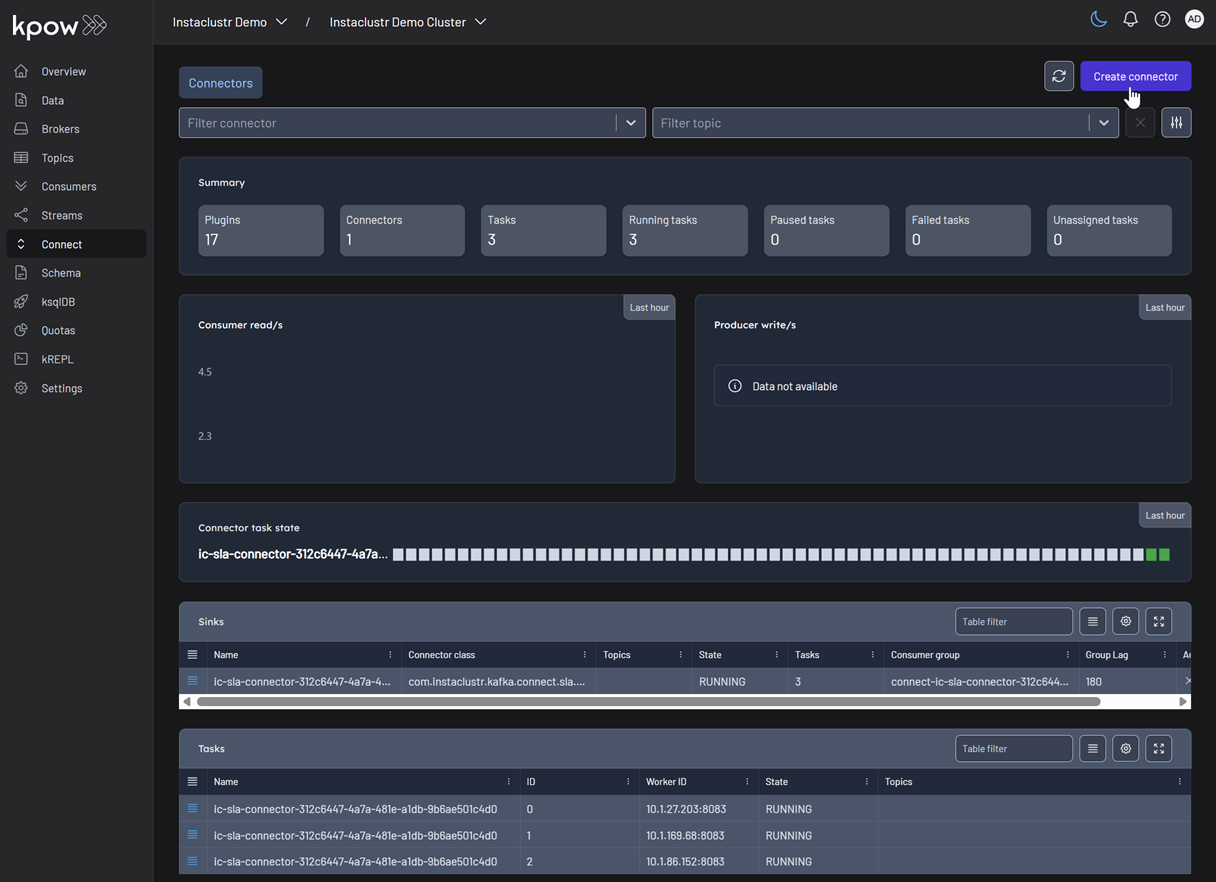
This will display a list of available connectors, which includes both the pre-built connectors provided by Instaclustr and the custom ones we uploaded. For this demonstration, we will select our custom GeneratorSourceConnector.

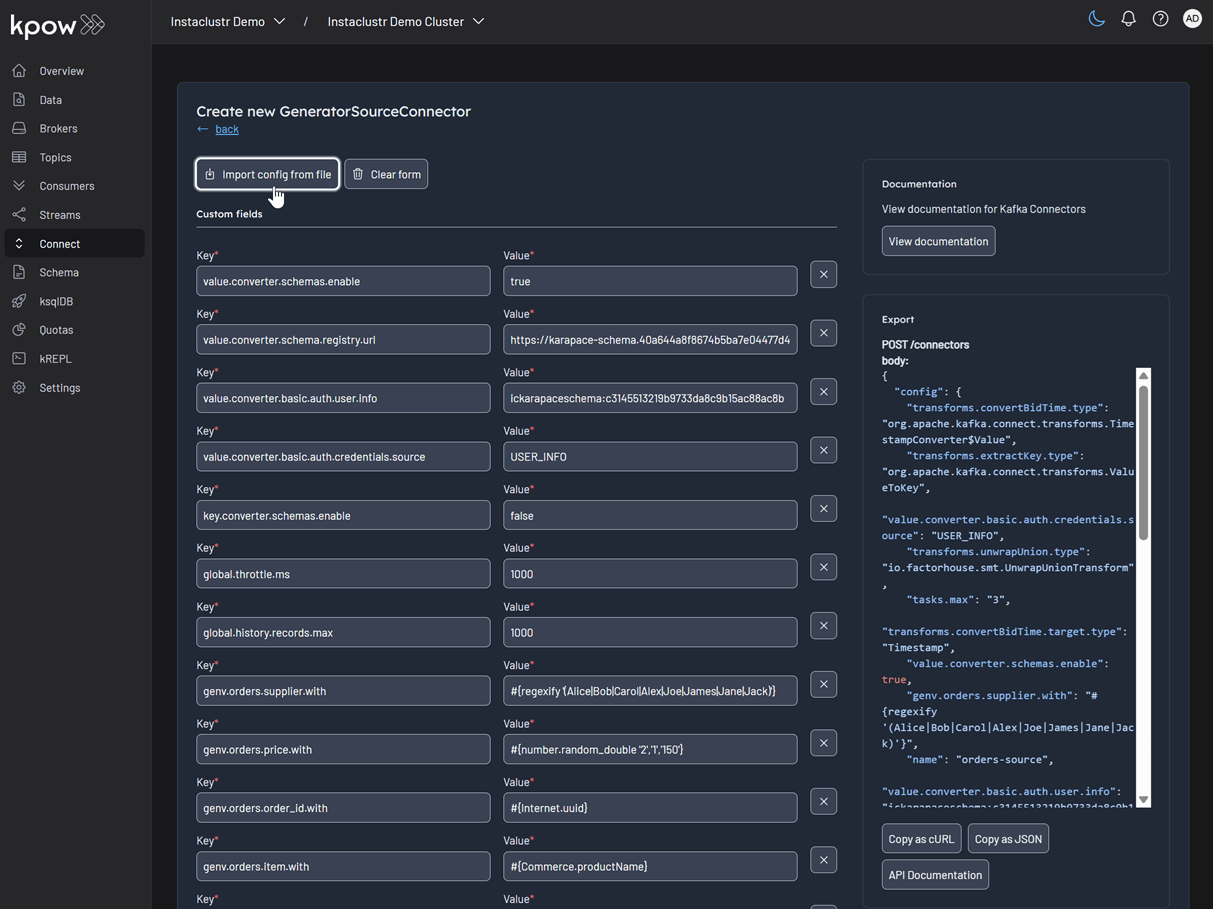
After selecting the connector, we can either input the configuration values manually or import a configuration file. We will import the JSON configuration file located at integrations/instaclustr-getting-started/connector/connector-source.json. We need to ensure that the schema registry URL and credentials in the file are updated with the correct values from our Instaclustr cluster.
Inspect the topic and schema
Once the source connector is deployed, we can verify that the orders topic has been created by navigating to the Topics menu. To view the messages being produced, we can go to Data > Inspect, select the orders topic, and click Search.
We can also inspect the Avro schema associated with our topic by navigating to the Schema menu.
Deploying the S3 sink connector
Similar to the source connector, we will now deploy the S3 sink connector to export the topic records to the S3 bucket we created earlier. We'll use the configuration file found at integrations/instaclustr-getting-started/connector/connector-sink.json. As before, we must ensure the schema registry connection details are correct, and we also need to provide the S3 bucket name and AWS credentials.
After the sink connector is deployed, we can verify that the topic records are being ingested as JSON files into our designated S3 bucket.

Conclusion
In this guide, we have successfully set up and integrated Kpow with a managed Apache Kafka environment on Instaclustr. We have seen how the connection details provided by the Instaclustr console can be seamlessly translated into a Kpow configuration, bringing our entire streaming ecosystem under a single, powerful user interface.
By walking through the practical example of deploying a data pipeline, we have demonstrated that this combination is more than just a monitoring solution. We used Kpow for active management of tasks: deploying a source connector, inspecting the live data flowing into our topics, viewing the associated schema in the registry, and finally deploying a sink connector to complete the pipeline. This highlights the core benefit of this integration: Instaclustr handles the difficult work of managing the infrastructure, while Kpow provides the intuitive, feature-rich toolkit needed for day-to-day development and operational tasks. With Kpow connected to your Instaclustr environment, you are empowered to manage your data pipelines with greater visibility, confidence, and efficiency.
Heading 1
Heading 2
Heading 3
Heading 4
Heading 5
Heading 6
Lorem ipsum dolor sit amet, consectetur adipiscing elit, sed do eiusmod tempor incididunt ut labore et dolore magna aliqua. Ut enim ad minim veniam, quis nostrud exercitation ullamco laboris nisi ut aliquip ex ea commodo consequat. Duis aute irure dolor in reprehenderit in voluptate velit esse cillum dolore eu fugiat nulla pariatur.
Block quote
Ordered list
- Item 1
- Item 2
- Item 3
Unordered list
- Item A
- Item B
- Item C
Bold text
Emphasis
Superscript
Subscript
.webp)
Introducing Webhook Support in Kpow
This guide demonstrates how to enhance Kafka monitoring and data governance by integrating Kpow's audit logs with external systems. We provide a step-by-step walkthrough for configuring webhooks to send real-time user activity alerts from your Kafka environment directly into collaboration platforms like Slack and Microsoft Teams, streamlining your operational awareness and response.
Overview
Kpow is an enterprise-grade toolkit for managing and monitoring Apache Kafka. A central feature for maintaining data governance is its audit log, which records all user actions. To enhance real-time monitoring and integration, Kpow can forward these audit log records to external systems via webhooks.
Kpow has long supported sending these notifications to Slack, and now also supports Microsoft Teams and any generic HTTP webhook server. This makes it possible to receive immediate alerts in your collaboration tools or integrate with custom monitoring systems that accept HTTP POST requests.
This guide provides a step-by-step walkthrough for configuring webhook integrations in Kpow for Slack, Microsoft Teams, and generic webhook servers. By the end, you’ll be able to stream real-time Kafka activity notifications directly into the platform of your choice.
💡 If you're interested in setting up monitoring and configuring alerts to stay on top of system performance, take a look at our earlier post: Kafka Alerting with Kpow, Prometheus, and Alertmanager.
About Factor House
Factor House is a leader in real-time data tooling, empowering engineers with innovative solutions for Apache Kafka® and Apache Flink®.
Our flagship product, Kpow for Apache Kafka, is the market-leading enterprise solution for Kafka management and monitoring.
Explore our live multi-cluster demo environment or grab a free Community license and dive into streaming tech on your laptop with Factor House Local.
Prerequisites
Webhook integration is an Enterprise feature of Kpow. To follow this guide, you will need an Enterprise license. If you do not have one, you can request a trial license from Factor House to explore this functionality.
Configure webhooks
Kpow has long supported sending webhook notifications to Slack, and now also supports Microsoft Teams and any generic HTTP webhook server. Configuration is handled via environment variables:
| Variable |
Required
|
Description |
|---|---|---|
| 'WEBHOOK_PROVIDER' |
Yes
|
The target provider: slack, teams, or generic
|
| 'WEBHOOK_URL' |
Yes
|
The endpoint that will receive webhook events via POST
|
| 'WEBHOOK_VERBOSITY' | No |
Event types to send: MUTATIONS, QUERIES, or ALL (default: MUTATIONS)
|
Before starting your Kafka environment, ensure that webhook URLs are created in your chosen platform (Slack, Teams, or generic endpoint).
Slack
To integrate Kpow with Slack, you need to create a Slack App and generate an incoming webhook URL.
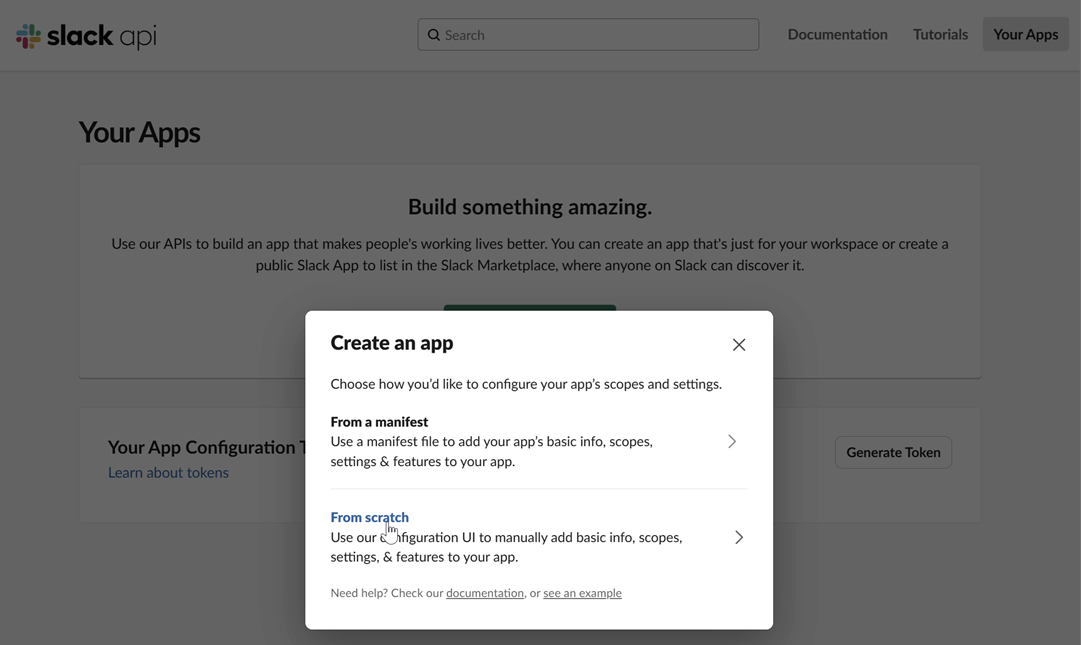
Create a Slack app: Navigate to the Slack API website and click on "Create New App". Choose to create it "From scratch".
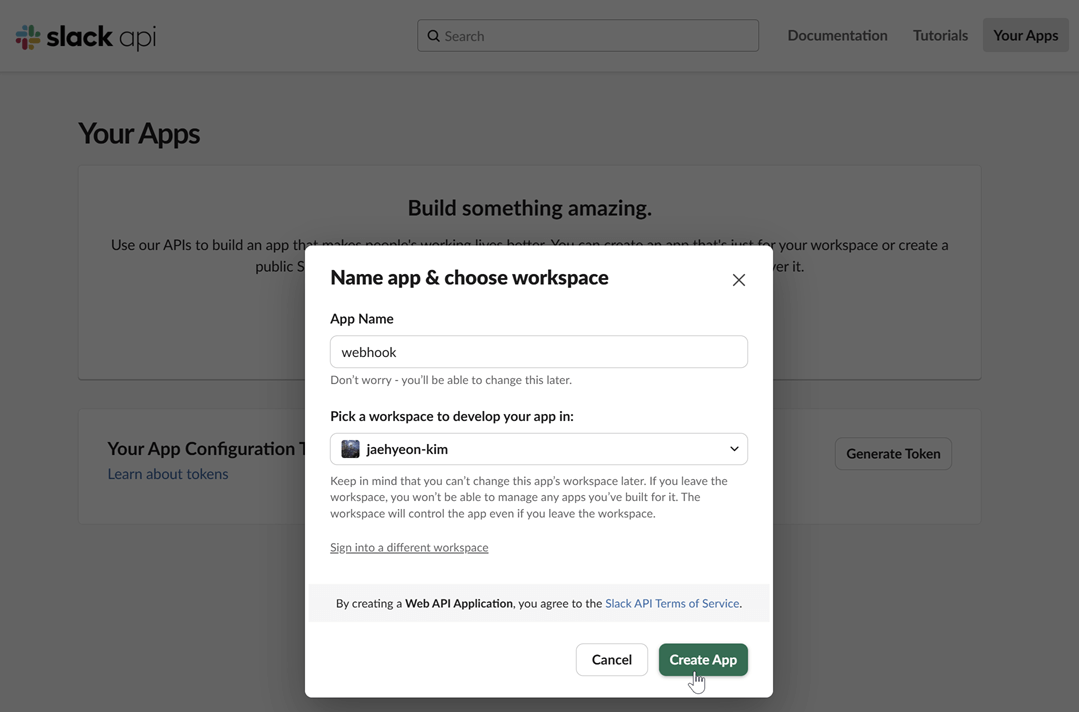
Name your app and choose a workspace: Provide a name for your application and select the Slack workspace you want to post messages to.
Enable incoming webhooks: In your app's settings page, go to "Incoming Webhooks" under the "Features" section. Toggle the feature on and then click "Add New Webhook to Workspace".
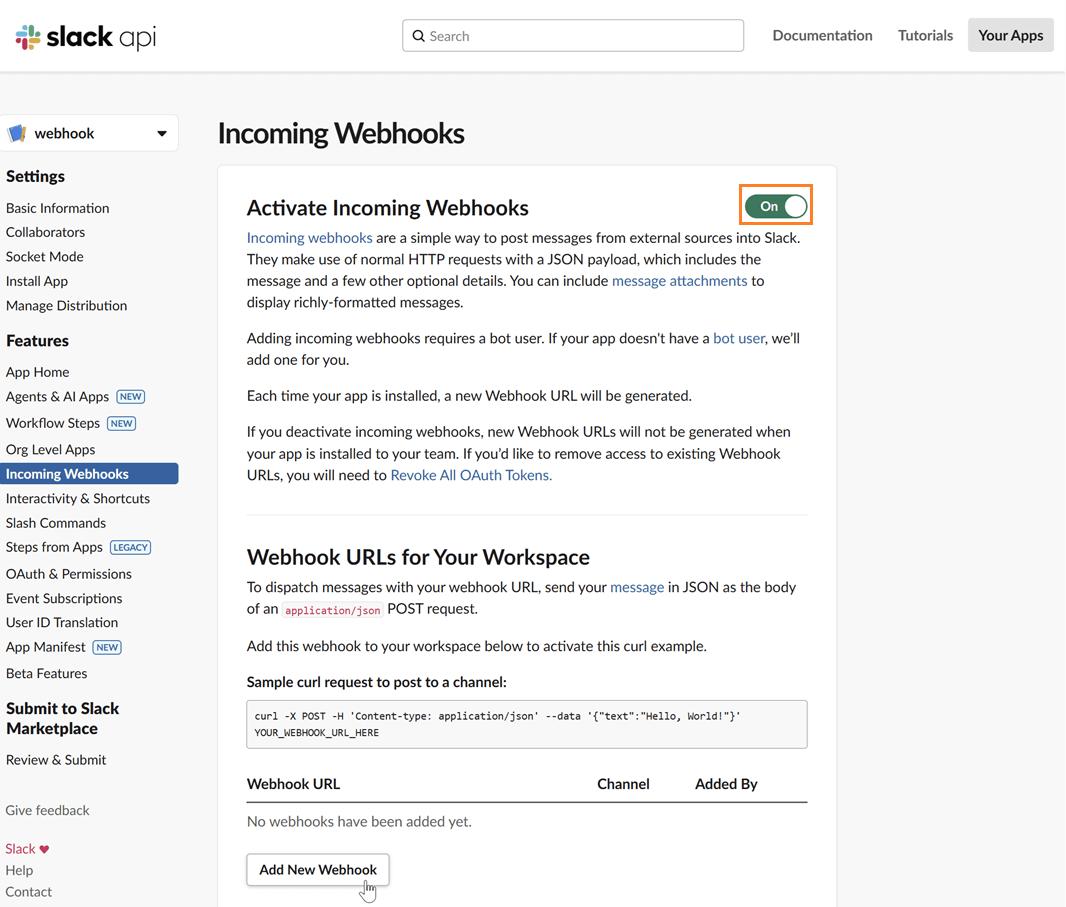
Select a channel: Choose the channel where you want the Kpow notifications to be posted and click "Allow".
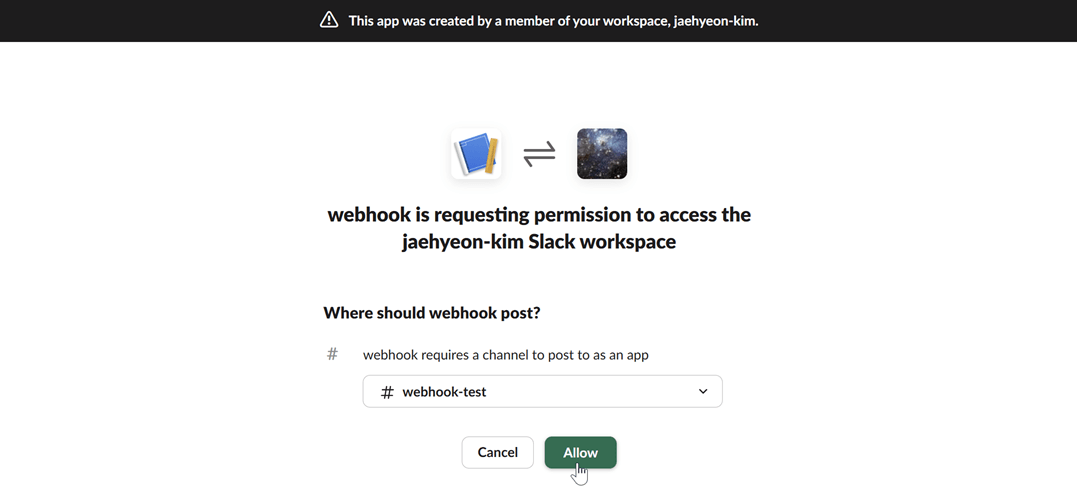
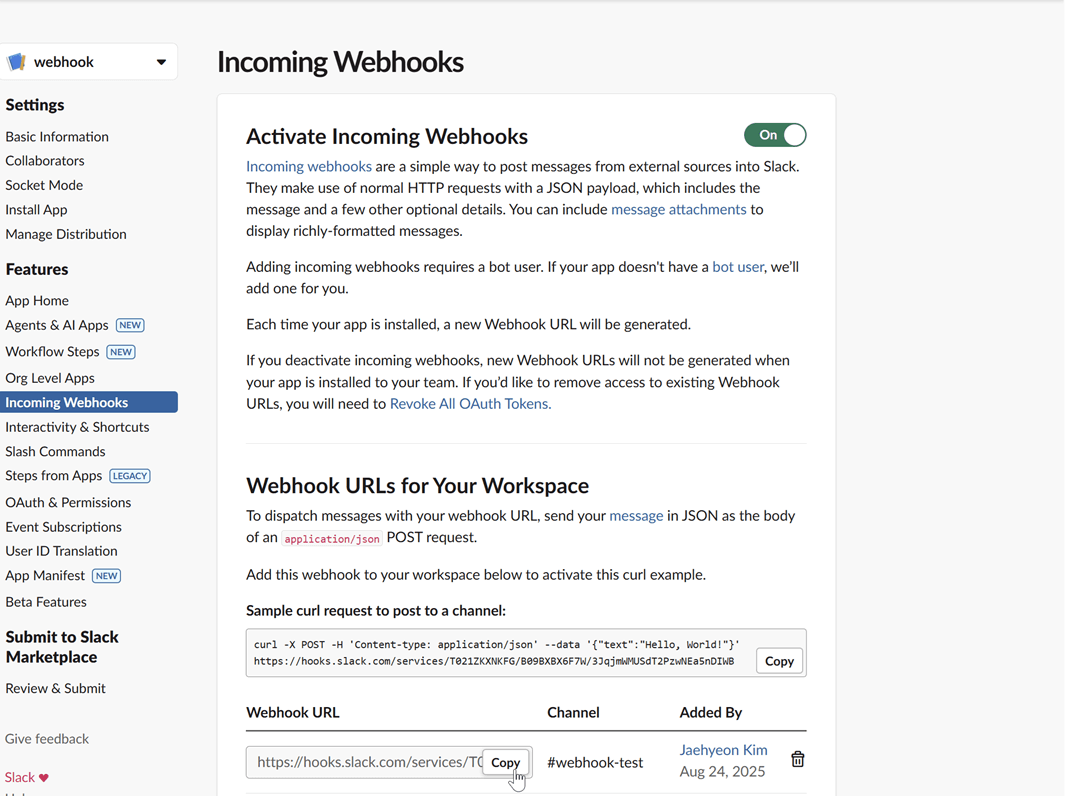
Copy the webhook URL: After authorizing, you will be redirected back to the webhook configuration page. Copy the newly generated webhook URL. This URL is what you will use to configure Kpow.
Microsoft Teams
For Microsoft Teams, integration can be set up through workflows by creating a flow that listens for an HTTP request.
Create a new flow: Navigate to workflows and start creating a new flow.
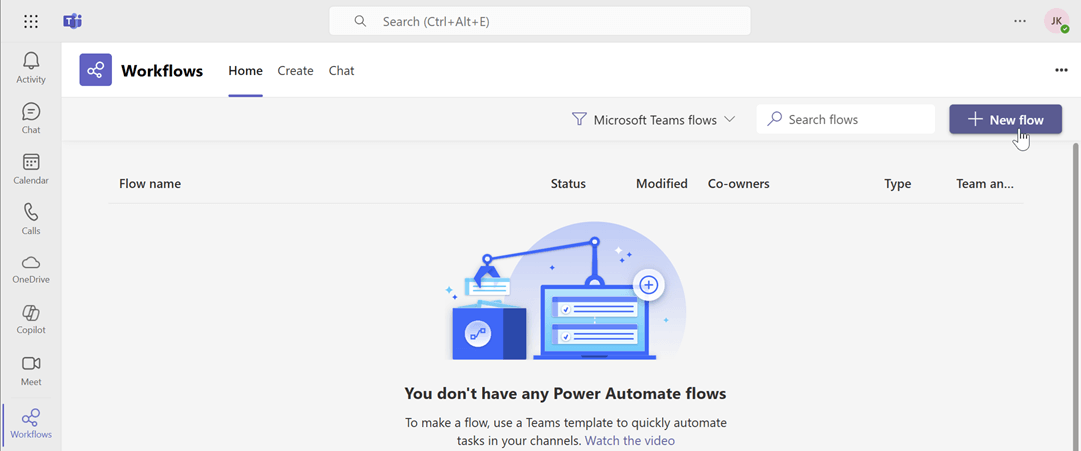
Search for the webhook template: In the flow creation interface, search for the keyword "webhook" to find relevant templates. Select the "Send webhook alterts to a channel" template.
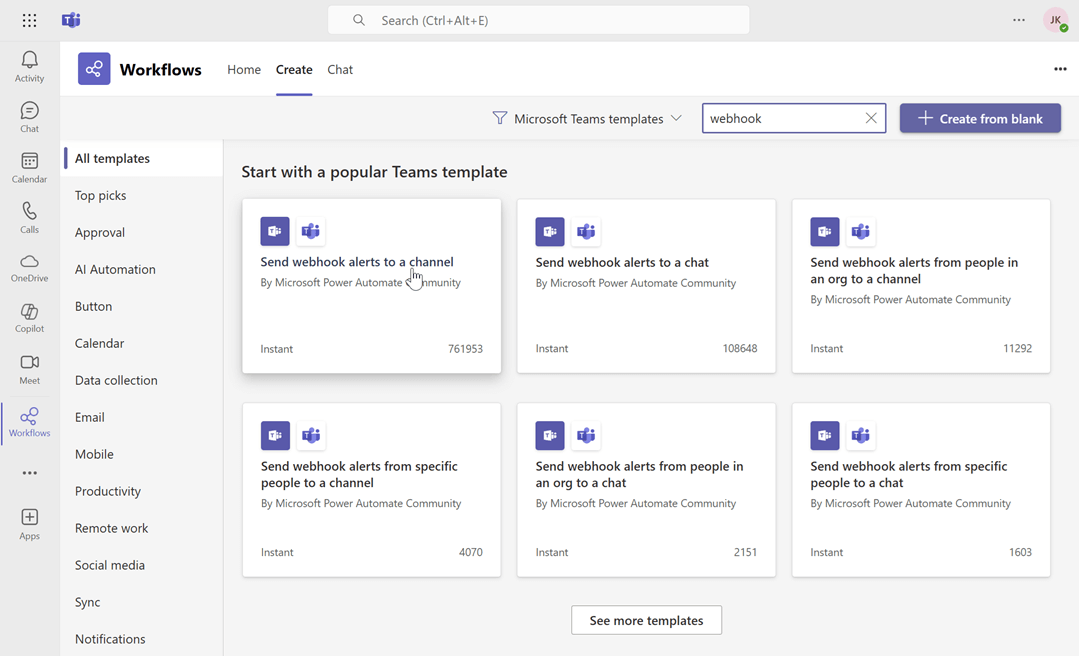
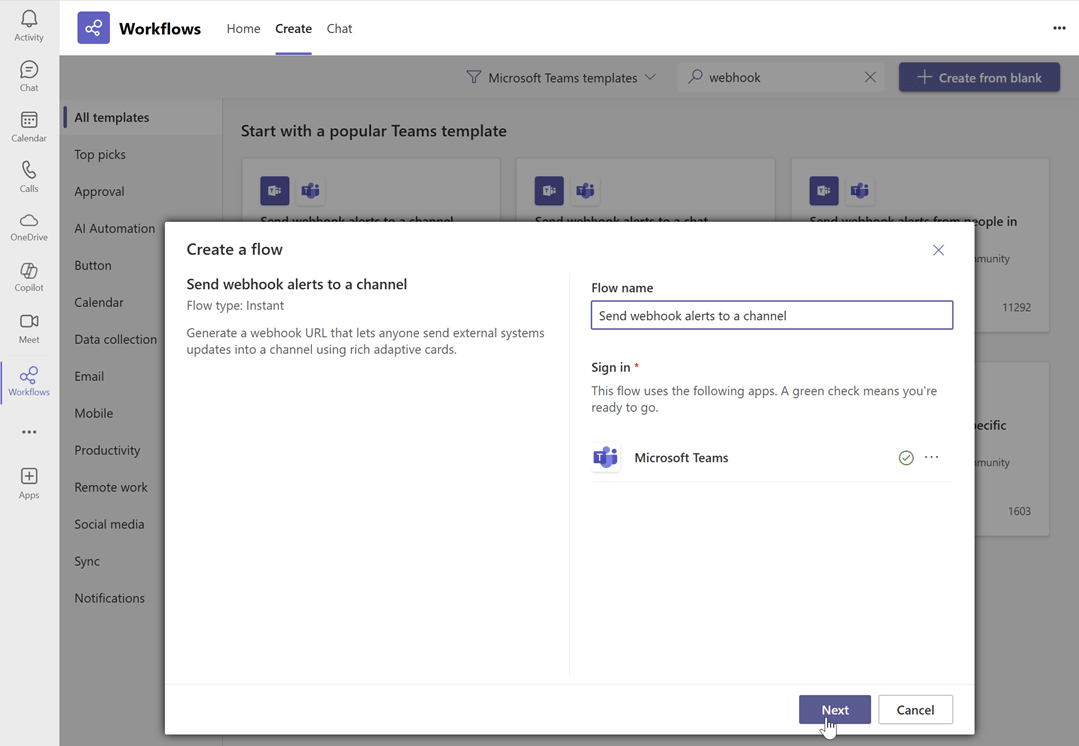
Name the flow and click next: Enter a name for your flow, then click Next.
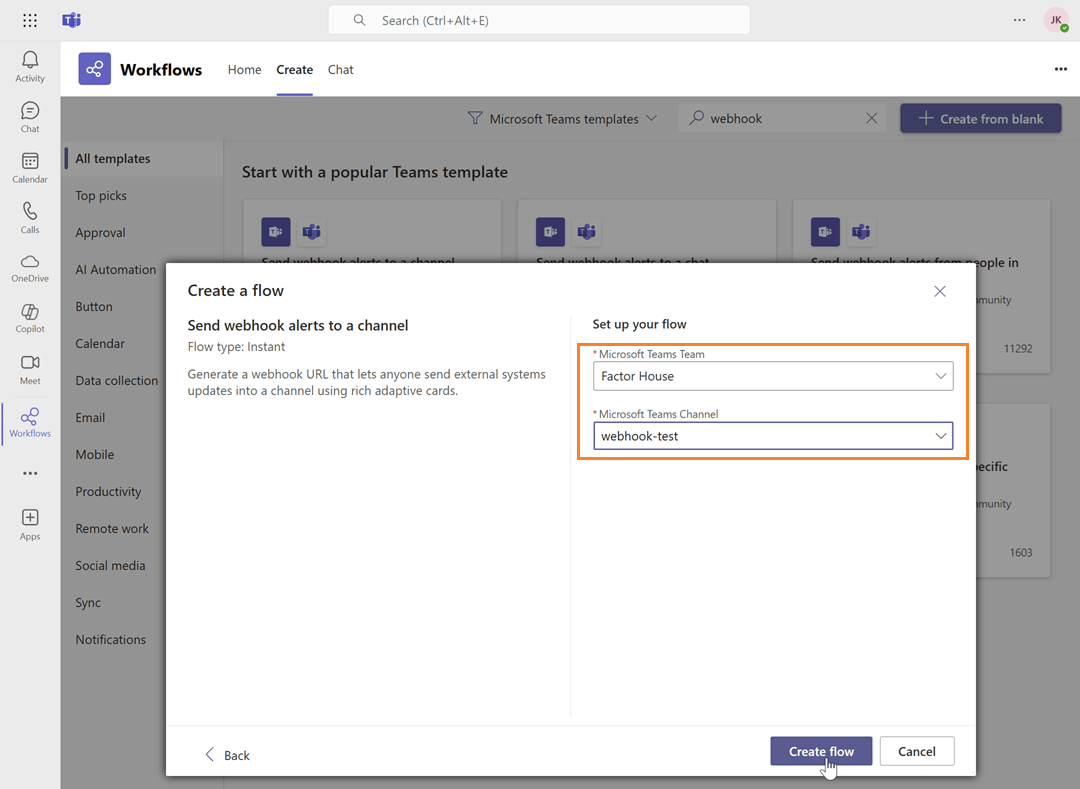
Select the team and channel Name: Choose the Microsoft Teams team and channel name, then click Create flow.
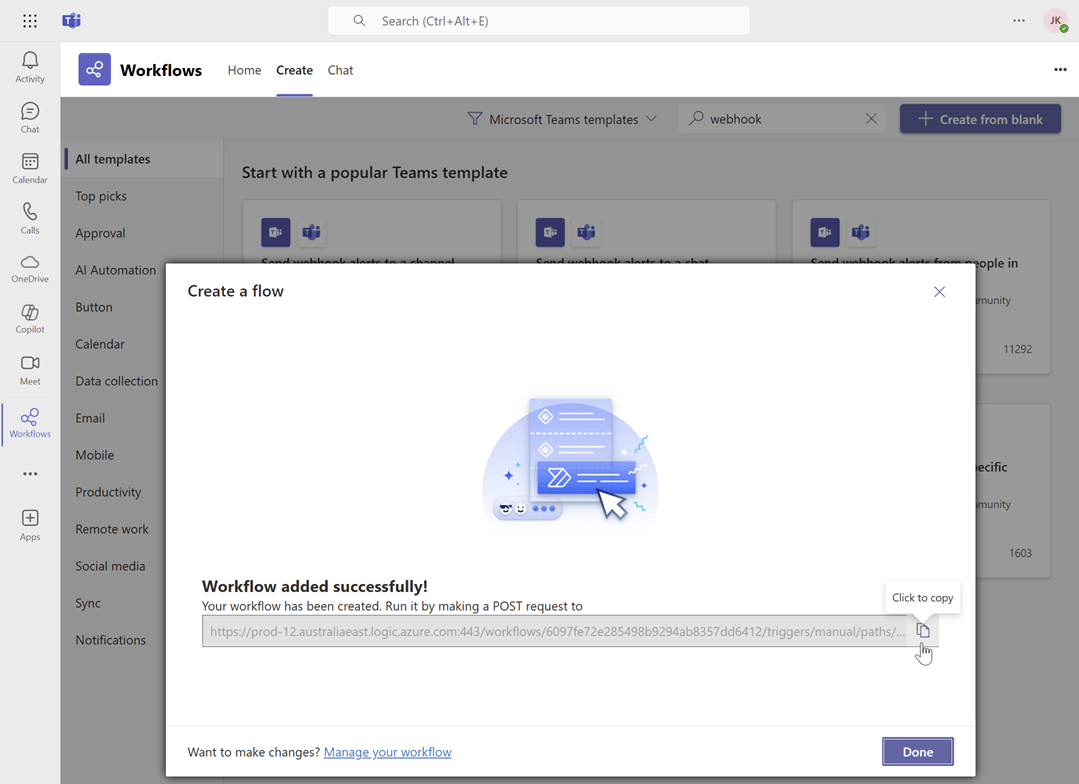
Copy the webhook URL: Copy the newly generated webhook URL. This URL is what you will use to configure Kpow.
Generic webhook server
A generic webhook allows you to send Kpow's audit log events to any custom application or third-party service that can receive HTTP POST requests. This is useful for integrating with systems that are not officially supported out-of-the-box or for building custom automation workflows. The payload is sent in JSON format, allowing for easy parsing and processing.
For this guide, we will be using a simple web server developed using Python Flask.
Launch Kafka environment
To test the webhook functionality, use the webhook-demo in the features folder of the Factor House examples repository on GitHub. This demo spins up three Kpow instances, each configured to send audit log messages to a different destination: Slack, Microsoft Teams, and a generic web server running on ports 3000, 4000, and 5000.
# Clone the examples repository
git clone https://github.com/factorhouse/examples.git

# Move to the web
cd features/webhook-demo

# Start Kafka environment with multiple Kpow instances that target different webhook backends
# Replace the placeholder values with your actual license and webhook URLs
export KPOW_LICENSE="<path-to-license-file>"
export SLACK_WEBHOOK_URL="<slack-webhook-url>"
export TEAMS_WEBHOOK_URL="<teams-webhook-url>"
export GENERIC_WEBHOOK_URL="http://webhook-server:9000"

docker compose up
Verify Slack webhook messages
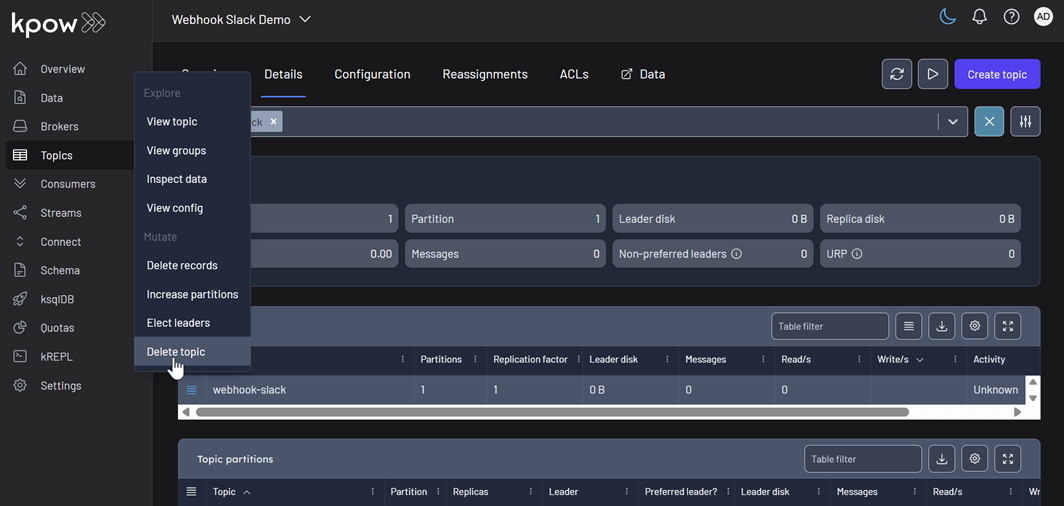
To test the Slack integration, perform an action in Kpow that generates an audit event, such as creating and then deleting a topic. You can access the Kpow UI at http://localhost:3000.
Create a topic
The example below shows how to create a new topic in Kpow.

Delete a topic
Similarly, you can delete a topic in Kpow as shown here.
View audit logs
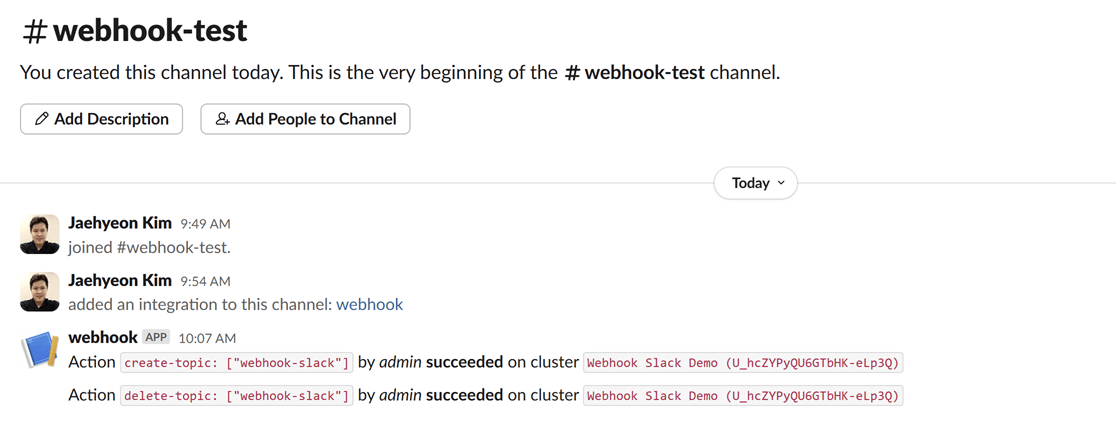
After performing these actions, you can verify they have been logged by navigating to Settings > Audit log in the Kpow UI.

On the Slack channel, you should see messages detailing the actions. Each message includes information such as the user who performed the action, the type of action (e.g., create-topic), and the cluster environment name.
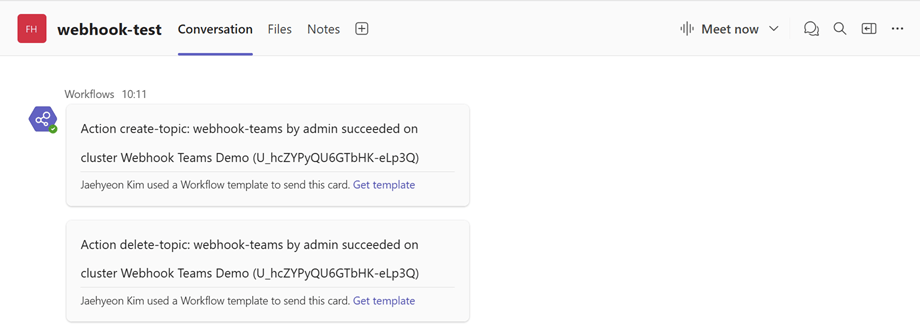
Verify Teams webhook messages
The process to verify messages in Microsoft Teams is the same. After creating and deleting a topic in the Kpow UI (accessible at http://localhost:4000), your Power Automate flow will trigger, and you will see the corresponding formatted message in your designated Teams channel.
Verify generic webhook messages
For the generic webhook, inspect the logs of the webhook server container by running docker logs webhook-server. The logs display the raw JSON payloads that Kpow sends for topic creation and deletion events, giving you insight into the data structure you can leverage for custom integrations.

Conclusion
Kpow's webhook integration is a powerful feature for enhancing the monitoring and security of your Apache Kafka environment. By sending real-time audit log notifications to platforms like Slack and Microsoft Teams, or to any custom endpoint via a generic webhook, you can ensure that your team is immediately aware of important events and changes. This capability not only improves transparency and collaboration but also allows for the creation of custom automation and integration with other operational tools, making your Kafka management more proactive and efficient.
Heading 1
Heading 2
Heading 3
Heading 4
Heading 5
Heading 6
Lorem ipsum dolor sit amet, consectetur adipiscing elit, sed do eiusmod tempor incididunt ut labore et dolore magna aliqua. Ut enim ad minim veniam, quis nostrud exercitation ullamco laboris nisi ut aliquip ex ea commodo consequat. Duis aute irure dolor in reprehenderit in voluptate velit esse cillum dolore eu fugiat nulla pariatur.
Block quote
Ordered list
- Item 1
- Item 2
- Item 3
Unordered list
- Item A
- Item B
- Item C
Bold text
Emphasis
Superscript
Subscript
.webp)
From Batch to Real-Time: A Hands-On CDC Project with Debezium, Kafka, and theLook eCommerce Data
This project transforms the static "theLook" eCommerce dataset into a live data stream. It uses a Python generator to simulate user activity in PostgreSQL, while Debezium captures every database change and streams it to Kafka. This creates a hands-on environment for building and testing real-time CDC pipelines.
Overview
The theLook eCommerce dataset is a valuable resource for data professionals. It provides a realistic, comprehensive schema for testing analytics queries and BI tools. However, it has one major limitation: it's static. It's a snapshot in time, designed for traditional batch workloads.
Modern data applications thrive on live, event-driven data. From real-time dashboards to responsive microservices, the ability to react to data as it changes is essential. How can we practice building these systems with a dataset that feels real?
To solve this, we've re-engineered theLook eCommerce data into a real-time, streaming data source. This project transforms the classic batch dataset into a dynamic environment for building and testing Change Data Capture (CDC) pipelines with Debezium and Kafka.
💡 The complete project, including all source code and setup instructions, is available on GitHub.
⚡ Looking for more hands-on labs and projects? Check out our previous posts: Introduction to Factor House Local and Building a Real-Time Leaderboard with Kafka and Flink to level up your streaming data skills.
What is Change Data Capture (CDC) with Debezium?
Change Data Capture is a design pattern for tracking row-level changes in a database (INSERT, UPDATE, DELETE) and making them available as an event stream. Instead of repeatedly querying a database for updates, CDC systems read the database's transaction log directly, capturing every committed change as it happens.
Debezium is a leading open-source, distributed platform for CDC. It provides a library of connectors that turn your existing databases into event streams. In this project, we use the Debezium PostgreSQL connector, which works by reading the database's write-ahead log (WAL). To enable this, the PostgreSQL server's wal_level is set to logical, which enriches the log with the detailed information needed for logical decoding.
With the Debezium PostgreSQL connector, we can use PostgreSQL's built-in pgoutput logical decoding plugin to stream the sequence of changes from the WAL. It operates on a push-based model, where the database actively sends changes to the Debezium connector as they are committed. The connector then processes these changes and pushes them as events to Kafka topics, ensuring low-latency data streaming.
Project Architecture: A Live eCommerce Store in a Box
This project combines a dynamic data generator with a complete CDC pipeline, allowing you to see the end-to-end flow of data.
Real-Time Data Generator
At the heart of the project is a Python-based simulator that brings theLook eCommerce dataset to life. It:
- Simulates continuous user activity, including new user sign-ups, product browsing, purchases, and even order updates like cancellations or returns.
- Writes this data directly into a PostgreSQL database, creating a constantly changing, realistic data source.
- Models complex user journeys, from anonymous browsing sessions to multi-item orders.
This component transforms PostgreSQL from a static warehouse into a transactional database that mirrors a live application.
CDC Pipeline with Debezium and Kafka
With data flowing continuously into PostgreSQL, we can now capture it in real-time.
- The PostgreSQL database is prepared with a
PUBLICATIONfor all tables in our eCommerce schema. This publication acts as a logical grouping of tables whose changes should be made available to subscribers, in this case, the Debezium connector. - A Debezium PostgreSQL connector is deployed and configured to monitor all tables within the schema.
- As the data generator writes new records, Debezium reads the WAL, captures every
INSERT,UPDATE, andDELETEoperation. - It then serializes these change events into Avro format and streams them into distinct Kafka topics for each table (e.g.,
ecomm.demo.users,ecomm.demo.orders).
The result is a reliable, low-latency stream of every single event happening in your e-commerce application, ready for consumption.
Why is This a Good Way to Learn?
This project provides a sandbox that is both realistic and easy to manage. You get hands-on experience with:
- Realistic schema: Work with interconnected tables for users, orders, products, and events—not just a simple demo table.
- Industry standard stack: Get familiar with the tools that power modern data platforms: PostgreSQL, Debezium, Kafka, and Docker.
- End-to-end environment: The entire pipeline is runnable on your local machine, giving you a complete picture of how data flows from source to stream.
What Can You Build With This?
A real-time stream of eCommerce events in Kafka opens up many possibilities for development. This project is the perfect starting point for:
- 🔍 Building real-time analytics dashboards with tools like Apache Flink or Apache Pinot to monitor sales and user activity as it happens.
- 🧊 Ingesting data into a lakehouse (e.g., Apache Iceberg) with Apache Flink to keep your warehouse continuously updated with real-time data.
- ⚙️ Developing event-driven microservices that react to business events. For example, you could build a
NotificationServicethat listens to theecomm.demo.orderstopic and sends a confirmation email when an order's status changes toShipped.
Get Started in Minutes
The entire project is containerized and easy to set up.
- Clone the factorhouse/examples repository from GitHub.
- Start the infrastructure (Kafka, PostgreSQL, etc.) using Docker Compose.
- Run the data generator via Docker Compose to populate the database.
- Deploy the Debezium connector and monitor Kafka topics as they are created and populated with real-time data.
We'd love to see what you build with this. Join the Factor House Community Slack and share what you're working on.
Conclusion
This project bridges the gap between static, batch-oriented datasets and the dynamic, real-time world of modern data engineering. It provides a practical, hands-on environment to learn, experiment, and build production-ready CDC pipelines with confidence.
Heading 1
Heading 2
Heading 3
Heading 4
Heading 5
Heading 6
Lorem ipsum dolor sit amet, consectetur adipiscing elit, sed do eiusmod tempor incididunt ut labore et dolore magna aliqua. Ut enim ad minim veniam, quis nostrud exercitation ullamco laboris nisi ut aliquip ex ea commodo consequat. Duis aute irure dolor in reprehenderit in voluptate velit esse cillum dolore eu fugiat nulla pariatur.
Block quote
Ordered list
- Item 1
- Item 2
- Item 3
Unordered list
- Item A
- Item B
- Item C
Bold text
Emphasis
Superscript
Subscript
.webp)
Building a Real-Time Leaderboard with Kafka and Flink
Learn how to build a real-time "Top-K" analytics pipeline from scratch using a modern data stack. This open-source project guides you through using Apache Kafka, Apache Flink, and Streamlit to ingest, process, and visualize live data, turning a continuous stream of events into actionable insights on an interactive dashboard.
Overview
In today's data-driven world, the ability to process and analyze information in real-time is a significant competitive advantage across many industries. Whether it's tracking top-selling products in e-commerce, identifying trending topics on social media, or monitoring high-performing assets in finance, real-time analytics pipelines are essential for gaining immediate insights.
This post explores a complete, open-source project that demonstrates how to build a real-time "Top-K" analytics pipeline. You'll learn how to ingest a continuous stream of data, process it on the fly to compute key performance metrics, and visualize the results on an interactive dashboard.
The core of this project is a robust data pipeline that can be broken down into three key stages:
- Data Generation: A Python script continuously generates a stream of simulated user events, which are then published to an Apache Kafka topic.
- Metrics Processing: Four distinct Apache Flink SQL jobs consume the raw data stream from Kafka. Each job is tailored to calculate a specific real-time leaderboard metric: Top Teams, Top Players, Hot Streakers, and Team MVPs. The results are written to their own dedicated Kafka topics.
- Dashboard Visualization: A Streamlit web application reads the processed metrics from the Flink output topics and presents them on a dynamic, real-time dashboard, offering at-a-glance insights into performance.
💡 The complete project, including all source code and setup instructions, is available on GitHub.
🚀 This project uses Factor House Local to spin up the development environment. See Introduction to Factor House Local to learn more about experimenting with modern data architectures using Kafka, Flink, Spark, Iceberg, and Pinot.

Diving into the Real-Time Metrics
The pipeline continuously computes four different leaderboard-style metrics using Flink SQL. A DDL script initially sets up the necessary source and sink tables. The source table, user_scores, reads directly from a Kafka topic. Each Flink SQL query consumes this stream, performs its calculations, and writes the output to a corresponding sink table (top_teams, top_players, hot_streakers, or team_mvps). These sink tables use the upsert-kafka connector, which ensures that the leaderboards are continuously updated as new data arrives.
- Top Teams: This metric identifies the top 10 entities (grouped as "teams") with the highest cumulative scores, providing a global view of group performance. The underlying Flink SQL query groups the data by
team_id, calculates a running sum of scores, and then ranks the teams. To ensure accuracy over long periods, the state for this data has a time-to-live (TTL) of 60 minutes. - Top Players: Similar to the Top Teams metric, this leaderboard showcases the top 10 individual entities (or "players") with the highest scores. The logic is much the same: the stream is grouped by
user_id, a cumulative score is calculated, and the entities are ranked globally. This also has a 60-minute TTL to maintain consistent stats over extended sessions. - Hot Streakers: This metric is designed to highlight the top 10 entities currently on a "hot streak," meaning their short-term performance is significantly outpacing their historical average. The query for this uses sliding time windows to calculate a short-term average (over 10 seconds) and a long-term average (over 60 seconds). The ratio between these two averages determines the "hotness." Since this metric focuses on recent activity, it uses a shorter state TTL of 5 minutes.
- Team MVPs: This metric first identifies the Most Valuable Player (MVP) for each team—the entity that contributed the largest percentage of the team's total score. It then ranks these MVPs across all teams to find the top 10 overall. This is achieved using Common Table Expressions (CTEs) in SQL to first calculate total scores per entity and per team, and then these are joined to determine each entity's contribution ratio.
Together, these metrics offer a rich, real-time view of system dynamics, highlighting top-performing groups, standout individuals, and rising stars. The final results are streamed to a responsive dashboard that displays the leaderboards in continuously refreshing bar charts, with each chart powered by its own dedicated Kafka topic.

Conclusion
This project serves as a practical blueprint for building powerful, real-time analytics systems. By combining the high-throughput messaging of Apache Kafka, the stateful stream processing of Apache Flink, and the rapid UI development of Streamlit, you can create sophisticated pipelines that deliver valuable insights with minimal latency.
The "Top-K" pattern is a versatile one, applicable to countless domains beyond the example shown here. The principles of stream ingestion, real-time aggregation, and interactive visualization form a solid foundation for any developer looking to harness the power of live data. We encourage you to clone the repository, run the project yourself, and adapt the architecture to your own unique use cases.
Join the Factor Community
We’re building more than products, we’re building a community. Whether you're getting started or pushing the limits of what's possible with Kafka and Flink, we invite you to connect, share, and learn with others.


